Faculty of Industrial Engineering and Management
COMBINATION OF TOOLS AND TECHNIQUES FOR PROJECT TEAMS TO ENHANCE PERFORMANCE

Francesca Coffani
Index
2.3 Success and Failure Factors – Why do Projects Succeed or Fail?
3. Project management software for the success of an engineering project
3.2 Comparison between Project Team Builder and Microsoft Project 2010
3.2.2 Educational software evaluation
4. Research Questions and Hypothesis
5.2 Research Questions and Hypotheses
5.4 Details of the Design of the Experiment
5.4.3 The Experiment procedure
6.2 Research Questions and Hypothesis
6.4 Details Design of the Experiments
6.4.3 The experiment procedure
1. Abstract
Today, modern project management has emerged as a premier solution in business operations. Large and small organizations recognize that a structured approach to planning and controlling projects is a necessary core competency for success.
The evolution of Innovation Technology and the new study in the industry have developed new tools to guarantee the success of project management activities.
The aim of this research is to discover new keys to improve the performances in the management of complex engineering projects.
The focus of this work is the analysis of the project management software simulator Project Team Builder (PTB) used stand alone or in combination with the commercial software Microsoft Project 2010 (MSP2010).
The research work has been divided in four sections.
The first part gives a picture of the analysis’s field through an objective comparison between PTB and MSP2010. The evaluation of the two tools is realized following two different criteria, the first one highlights the technical characteristics of the tools, and the second one appraises the softwares from educational point of view.
In the second part a quantitative and qualitative analysis of the problem has been executed. All the data and the informations used have been collected thanks two experiments effectuated in collaboration with the Industrial and Management Engineering Department of Technion Israel Institute of Technology at Haifa. The purpose of the two experiments is to gather information about the performance of the two tools working in combination, or separately, in order to find what are the major weaknesses and strengths, and to finally understand what it could be changed in the PTB simulator to increase the final performance in the project management.
In the third section of the research the data of the experiments have been collected and analyzed. The quantitative evaluation of the data has been realized in collaboration with the statistical department of the Technion Israel Institute of Technology, while the qualitative analysis has been completed following an official method of qualitative analysis.
In the fourth and last part of the work all the results obtained during the entire research have been evaluated. Only at the end of this phase it has been possible to define what would be the best option among MSP, PTB or the combination of the two software programs for planning a complex engineering project.
Furthermore, in the last part it has been possible to identify new points to increase the final performance of PTB in the engineering project management.
2. Introduction
2.1 General
“Being a Project Manager is like being an artist, you have the different colored process streams combining into a work of art” – Greg Cimmarrusti, PMP
It must be considered that there is nothing more difficult to carry out nor more doubtful of success nor more dangerous to handle than to initiate a new order of things – Machiavelli
Project management is … The art of creating the illusion that any outcome is the result of a series of predetermined, deliberate acts when, in fact, it was dumb luck. – Harold Kerzner
"Predictable things happen when we start describing our projects as battles. People behave as if they are soldiers. Directions become orders. Work becomes fierce competition. Plans become immutable. Enemies emerge. We and our opponents become less than human, shrinking as individuals. Our Technicolor world fades into opaque wrongs and colorless rights, when our success requires a palette filled with the possibility."- The Blind Men and the Elephant by David Schmaltz
Project management is the discipline of planning, organizing, motivating, and controlling resources to achieve specific goals. A project is a temporary endeavor with a defined beginning and end (usually time-constrained, and often constrained by funding or deliverables), undertaken to meet unique goals and objectives, typically to bring about beneficial change or added value.
Project management is the discipline of organizing and managing resources in such a way that these resources do all the work required to complete a project within defined scope, time and cost constrains. The first challenge of project management is to ensure that a project is delivered within a set of defined constraints. The next step is to optimize the allocation and integrate the inputs needed to meet those pre-defined requirements. Project management is a complex task and requires varying technical skills and philosophy.
The main and most important goal of every project manager is to complete his own project with success.
2.2 What is project success?
A project can only be successful if the success criteria were defined upfront. When starting on a project, it is essential to work actively with the organization that owns the project, in order to define success across three elements:
· Project completion success: this is about defining the criteria by which the process of delivering the project is successful. Essentially this addresses to time, budget, scope and quality. It is limited to the duration of the project, and success can be measured as soon as the project is officially completed.
· Product/service success: this is about defining the criteria by which the product or service delivered is deemed successful. These criteria need to be measured once the product/service is implemented and over a defined period of time.
· Business success: this is about defining the criteria by which the product/service delivered brings value to the overall organization, and how it contributes financially and/or strategically to the business.
The literature provides several definitions of project success. To understand its real meaning is necessary to consider all the different theories together.
As explained by Mr Orhof in his paper: traditionally, project success was measured against the “Triple Constraint” or the "Iron Triangle" – Performance, Schedule and Budget, but this definition proved itself to be partial and sometimes misleading.
Cleland (1986) defined project success as "meaningful only if considered from two vantage points: the degree to which the project's technical performance objective was attained on time and within budget; the contribution that the project made to the strategic mission of the enterprise." He added one more element to the three features of triple constraint, and that element is the contribution to costumer.
De Wit (1988), indeed distinguished between project management success (meeting the triple constraint), as opposed to project success, defined by the ability to meet the overall objectives of the project.
Pinto and Slevin (1988) diversify internal project success (that comes from triple constraints) from external project success related to the client use, satisfaction and effectiveness.
Baker, Fisher and Murphy (1988) confirmed the importance of customer satisfaction as a project success measure. Furthermore, they suggested extending the success measurement to four different stakeholders groups: the customer organization, the developing organization, the project team, and the end user.
One of the most recent studies about project success by Shenhar, Dvir and Levy highlights four distinct elements for the success: project efficiency, customer satisfaction, business success and future potential. The importance of these four elements depends on time, as shown in the picture below.
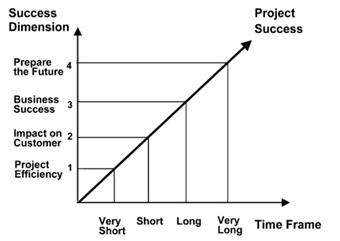
PICTURE n. 1 Project success diagram
This first analysis explain what is a successful project, and shows the need to answer to a couple more questions: what are the project’s critical success factors, and which factors does the project manager have to avoid preventing failure?
2.3 Success and Failure Factors – Why do Projects Succeed or Fail?
Several researches about success and failure factors exist. In 1996 Belassi and Tukel present seven different lists of critical success factors. Belassi and Tukel grouped the critical success factors from the seven lists into four areas that influence the project performance: factors related to the project, factors related to the project manager and the team members, factors related to the organization, and factors related to the external environment.
In 1998 Pinto and Slevin took a different approach to the of critical success factors. In a previous research (1986) they identified 10 success factors, all within the project management control.
The 10 critical success factors within the project management control, used by Pinto and Slevin, were defined as follows:
1. Project mission – Initial clarity of goals and general directions
2. Top management support – Willingness of top management to provide the necessary resources and authority/power for project success
3. Project schedule/plans – a detailed specification of the individual action steps required for project implementation
4. Client consultation – Communication, consultation, and active listening to all impacted parties
5. Personnel – Recruitment, selection, and training of the necessary personnel for the project team
6. Technical tasks – Availability of the required technology and expertise to accomplish the specific technical action steps
7. Client acceptance – The act of "selling" the final project to its ultimate intended users
8. Monitoring and feedback – Timely provision of comprehensive control information at each phase in the implementation process
9. Communication – The provision of an appropriate network and necessary data to all key factors in the project implementation
10. Troubleshooting – Ability to handle unexpected crises and deviations from plan
The research of Pinto and Slevin showed that in order to adapt a victorious strategy toward project implementation, the project manager must consider the importance of different success factors depending on the current life cycle of the project.
In a second moment Pinto and Mantel (1990), studied the Causes of Project Failure.
Pinto and Mantel in their analysis conclude that “while projects have some fundamental similarities in terms of the factors that can determine their success or failure, there are some important contingency variables that force us to recognize that the causes of failure can, and do, differ in important ways among projects… project success or failure must be assessed based on several criteria, not on one monolithic measure… project’s success or failure is often in the eye of the beholder.”
They accept the idea that different types of projects should be handled differently.
Furthermore the project success is one of the most complex topic in project management and one of the most difficult steps for the project manager.
Today project managers can overcome these difficult steps. The Innovations of the new technologies and the born innovative project management’s software give support to PMs in every phase of the project, increasing the probability of a final success of their own projects.
3. Project management software for the success of an engineering project
In the previous chapter I have talked about the success and failure factors in a project.
The modern project management software products have given the opportunity to overcome the major problems.
Today, there are several project-management software products that, among other functions, help the project managers to organize their business better, collaborate more effectively, and plan and track projects comprehensively.
There are a wide variety of project management software packages available, including web-based applications accessible from any location. However, even though each software package boasts its own set of features, they all share common benefits that businesses can appreciate.
3.1 The tools for my research
Project management software is software used for project planning, scheduling, resource allocation and management change. It allows project managers (PMs), stakeholders and users to control costs and manage budgeting, quality management and documentation, and it may be also used as an administration system. Project management software is also used for collaboration and communication between project stakeholders.
Although
project management software is used in a variety of ways, its main purpose is
to facilitate the planning and tracking of project components, stakeholders and
resources.
The main goal of this research is to evaluate
the individual and combined performance of two project management software
products.
The first one is the Project Team Builder, a project management simulation tool developed at “Technion”, Israel institute of technology, for training and teaching the concepts of project management and for improving project decision making. Research based on the PTB was conducted at the Technion, Pennsylvania State University, Drexel University and Australian National University. Project team builder (sometimes abbreviated as PTB) is a project management simulation tool developed for training and teaching the concepts of project management and for improving project decision making. The PTB won the Project Management Institute Professional Development Product of the Year Award for 2008. The PTB is used in universities and business organizations around the world. The simulator is based on an approach that separates the simulation engine from the scenario editor and allows each user (or teacher) to simulate any project. The simulation engine simulates the dynamic stochastic nature of modern projects.
Project Team Builder is composed by two parts:
- PTB is a simulator designed for teaching project management and for training project managers in using the tools and techniques of project management. It provides an environment for practicing team working in managing dynamic stochastic projects. The PTB can be used as a stand-alone system ad it contains models for scheduling, budgeting, resource management, cash management, monitoring and control. Also, it can be used with Microsoft Project that integrates and completes the performance of the simulator.
- PTB scenario builder is used to build a specific scenario for a specific project. The Project Team Builder editor builds scenarios for the PTB simulator. The editor user has to define a project (scenario) that the simulator user can plan and execute. Each scenario includes information on target, cash, work packages, tasks, modes and resources. The PTB editor is a web-based tool. It can be used by downloading it on the SandboxModel website, following the same steps described earlier for the PTB simulator.
As explained above, the present research is focused on the analysis of the PTB’s performance and its performance when combined with MSP, in order to manage complex engineering projects.
The second tool is Microsoft Project 2010, commercial software by Microsoft. It is one of the most common project management tools on the project management software market.
Microsoft Project is a project management software program, developed and sold by Microsoft, which is designed to assist a project manager in developing a plan, assigning resources to tasks, tracking progress, managing the budget, and analyzing workloads.
Microsoft Project was the company's third Microsoft Windows-based application, and within a couple of years of its introduction it became the dominant PC-based project management software.
The project creates budgets based on assignment work and resource rates. As resources are assigned to tasks and assignment work estimated, the program calculates the cost, equal to the work times the rate, which rolls up to the task level and then to any summary tasks and finally to the project level. Resource definitions (people, equipment and materials) can be shared between projects using a shared resource pool. Each resource can have its own calendar, which defines what days and shifts a resource is available. Resource rates are used to calculate resource assignment costs which are rolled up and summarized at the resource level. Each resource can be assigned to multiple tasks in multiple plans and each task can be assigned to multiple resources, and the application schedules task work based on the resource availability as defined in the resource calendars. All resources can be defined in label without limit. Therefore it cannot determine how many finished products can be produced with a given amount of raw materials. This makes Microsoft Project unsuitable for solving problems of available materials constrained production. Additional software is necessary to manage a complex facility that produces physical goods.
The application creates critical path schedules, and critical chain and event chain methodology third-party add-ons also are available. Schedules can be resource leveled, and chains are visualized in a Gantt chart. Additionally, Microsoft Project can recognize different classes of users. These different classes of users can have differing access levels to projects, views, and other data. Custom objects such as calendars, views, tables, filters, and fields are stored in an enterprise global which is shared by all users.
Microsoft Project helps managers to easily plan projects and collaborate with others. Stay organized and keep each project on track with the only project management system designed to work seamlessly with other Microsoft applications and cloud services.
Microsoft Project can be integrated with PTB. In fact the project managers can choose to schedule and plan own projects on MSP and then export his scenario on PTB. At this stage the project can be simulated. The final values obtained are a sign of the goodness and effectiveness of the initial planning. Furthermore if the project manager is not satisfied by the final results he can decide to come back on MSP, change his own scheduling, and simulate a new scenario.
3.2 Comparison between Project Team Builder and Microsoft Project 2010
As previously mentioned, the principle scope of this research is to compare two different project management softwares used in two project management’s courses at the Technion Institute of Technology in Haifa, in Israel. The two tools are Project Team Builder (PTB) and Microsoft Project 2010(MSP).
This section shows the main characteristics of each tool and it highlights the principal existing difference between them.
At the beginning, we perform an analysis in order to compare the two software programs in main project management topics. The list below shows the most important of them. Both tools are:
- Collaborative software or groupware: a collaborative software is an application software designed to help people involved in a common task to achieve goals
- An issue tracking system: an issue tracking system is a computer software package that manages and maintains lists of issues.
- Scheduling: scheduling means to assign an appropriate number of workers to the jobs during each day of work. It determines when an activity should start or end, depending on its duration, predecessor activity (or activities), predecessor relationships, resource availability, and target completion date of the project.
- Project Portfolio Management (PPM): a PPM is the centralized management of processes, methods, and technologies used by project managers and project management offices (PMOs) to analyze and collectively manage a group of current or proposed projects based on numerous key characteristics. The objectives of PPM are to determine the optimal resource mix for delivery and to schedule activities to best achieve an organization’s operational and financial goals ― while honoring constraints imposed by customers, strategic objectives, or external real-world factors.
- Resource management: a RM is the efficient and effective deployment of an organization's resources when they are needed. Resource management is a key element to activity resource estimation, and project human resource management.
- Document management system (DMS): a DMS is a computer system (or set of computer programs) used to track and store electronic documents. It is usually also capable of keeping track of the different versions modified by different users (history tracking).
- Workflow: a workflow consists of a sequence of concatenated (connected) steps. Emphasis is on the flow paradigm, where each step follows the precedent without delay or gap and ends just before the subsequent step may begin.
- Report or Account: a report or account is any informational work (usually of writing, speech, television, or film) made with the specific intention of relaying information or recounting certain events in a widely presentable form.
The table presents the tab summaries of the differences that have just been described.
|
Software |
Collaborative software |
Issue tracking system |
Scheduling |
Project portfolio Management |
|
Microsoft Project 2010 |
No |
No |
Yes |
No |
|
Project Team Builder |
Yes |
No |
Yes |
Yes |
CHART n. 1a Comparison of project management’s software products
|
Software |
Resource Management |
Document Management |
Workflow system |
Reporting and analyses |
|
Microsoft Project 2010 |
Yes |
No |
No |
Yes |
|
Project Team Builder |
Yes |
No |
Yes |
Yes |
CHART n. 1b Comparison of project management’s software products
At the end of the first step the main features of the two software programs are analyzed deeper.
For this section of the literature a lot of criteria of software evaluations are found. Two different major criteria are chosen, because they allow studying the tools from two completely different points of view.
The first criteria evaluate tools for the software program’s characteristics, while the second one analyzes tools from the educational point of view.
3.2.1 Software evaluation
The first criteria, used to compare the two tools, are completely part of Mike Jackson’s research. In his work Jackson highlights that a criteria-based assessment gives a measurement of quality in a number of areas. These areas are derived from ISO/Iec 9126-1 Software engineering – Product quality and include usability, sustainability and maintainability.
Mr. Jackson affirms that the assessment involves checking whether the software, and the project that develops it, conforms to various characteristics, or that it exhibits various qualities that are expected for sustainable software. The more characteristics that software satisfies, the more sustainable it is. In performing the evaluation, it is desired to consider how different user classes affect the importance of the criteria.
The assessment criteria are grouped as follows.
|
Criterion |
Sub-criterion |
Notes-to what extent is/does the software. |
|
Usability |
Understandability |
Easily understood? |
|
|
Documentation |
Comprehensive, appropriate, well-structured user documentation? |
|
|
Buildability |
Straightforward to build or to support a system? |
|
|
Installability |
Straightforward to install on a supported system? |
|
|
Learnability |
Easy to learn how to use its functions? |
CHART n. 2 Usability criteria
|
Sustainability maintainability |
Identity |
Project/software identity is clear and unique? |
|
|
Community |
Evidence of current/future community? |
|
|
Accessibility |
Evidence of current/future ability to download? |
|
|
Analyzability |
Easy to understand at the source level? |
|
|
Evolvability |
Evidence of current/future development? |
|
|
Interoperability |
Interoperable with other required/related software? |
CHART n. 3 Sustainability maintainability criteria
These elements are used to better understand the relevant differences between the two tools in each of their area.
Usability
1. Understandability
A) How straightforward is to understand (what the software does and its purpose, the intended market and users of the software, the software’s basic functions, the software’s advanced functions)?
· Microsoft Project 2010: It is designed to assist a project manager in developing a plan, assigning resources to tasks, tracking progress, managing the budget, and analyzing workloads. The basic functions of MSP are:
Ø Creation of critical path schedules, critical chain and event chain methodology
Ø Scheduling can be resourced leveled
Ø Chains are visualized on Gantt chart
Ø MSP recognizes different classes of users
Ø Interoperability
Ø User controlled scheduling
Ø Ribbons
Ø Timeline
Ø SharePoint 2010 list synchronization
Ø Inactive tasks
Ø The team planner view
Ø Align vision and effort
Ø Strengthen and improve everyday collaboration
Ø Effectively manage resources
· Project Team Builder: The Project Team Builder is a teaching aid designed to facilitate the teaching of project management in a dynamic, stochastic, multi-project environment. PTB is designed to train engineering students and managers to exploit the ability of modern decision support systems to collect store, process and present large quantities of real time information.
The PTB is based on the following principles:
Ø A simulation approach: the Project Team Builder simulates one or more projects. The simulation is controlled by a simple user interface and no knowledge of simulation or simulation languages is required.
Ø A case study approach: the Project Team Builder is based on a simulation of case studies. Each case study is a project or a collection of projects performed under schedule, budget and resource constraints, in a dynamic stochastic environment. The details of these case studies are built into the simulation and all the data required for analysis and decision-making is easily accessed by the user interface. A user-friendly case study generator facilitates the development of new case studies as required.
Ø A dynamic approach: the case studies built into the Project Team Builder are dynamic and the situation changes over time. A random effect is introduced to simulate the uncertainty in the environment, and decisions made by the user cause changes in the state of the system simulated.
Ø A model-based approach: a decision support system is built into the Project Team Builder. This system is based on project management concepts. The model base contains well-known models for scheduling, budgeting, resource management and monitoring and control. These models can be consulted at any time.
Ø To support decision-making further, a database is built into the Project Team Builder. Data on the current state of the simulated system is readily available to the users. Furthermore, it is possible to use the data as input to the models in the model base to support decision-making.
Ø An integrated approach: several projects can be managed simultaneously on the PTB. These projects share the same resources and a common cash flow.
Ø User friendliness and GUI: the Project Team Builder is designed as a teaching and training tool. As such, its Graphic User Interface (GUI) is friendly and easy to learn. Although quite complicated scenarios are simulated, and the decision support tools are sophisticated, a typical user can learn how to use the Project Team Builder within an hour.
Ø Integration with commercial project management tools: the Project Team Builder is integrated with commercial project management software so that the users can analyze the scenario on the commercial project management software and support decisions with tools that are actually used in his organization.
The PTB provides a supportive setting for training in Project Management and for developing, evaluating and testing new methods for project management, like the techniques developed for estimating the project duration.
B) Description of what/who the software is for is available, what the software does is available, and how the software works is available
· Microsoft Project 2010: MSP is available for Windows XP, Windows vista, Windows 7 or 8. Microsoft Project creates budgets based on assignment work and resource rates. As resources are assigned to tasks and assignment work estimated, the program calculates the cost, equal to the work times the rate, which rolls up to the task level and then to any summary tasks and finally to the project level. Resource definitions (people, equipment and materials) can be shared between projects using a shared resource pool. Each resource can have its own calendar, which defines what days and shifts a resource is available. Resource rates are used to calculate resource assignment costs which are rolled up and summarized at the resource level. Each resource can be assigned to multiple tasks in multiple plans and each task can be assigned to multiple resources, and the application schedules task work based on the resource availability as defined in the resource calendars. All resources can be defined in labels without limit. Therefore it cannot determine how many finished products can be produced with a given amount of raw materials. This makes Microsoft Project unsuitable for solving problems of available materials of constrained production. Additional software is necessary to manage a complex facility that produces physical goods.
· Project Team Builder: The Project Team Builder (PTB) is now available from Sandbox Model (2010). There are different features that make this tool more available. First of all, the possibility for the user to analyze and learn the history recording, in the second, the tool has its own database that supports the user in his decision-make; these two features allow to increase the performance and the learning in the new user.
PTB contains widely used models of project management: network and Gantt charts for project scheduling, cash flow charts for budget planning, resource load charts for resource planning, Monte Carlo simulation for risk management, and a monitoring and control module for tracking project performance.
Following there is a list of the decision that PTB supports:
ü Project design definition
ü Project scope responsibility allocation
ü Definition and design of work packages
ü Schedule planning
ü Definition of central milestones for progress monitoring
ü Planning and definition of project tasks
ü Planning and defining human resources for project tasks
ü Preparing a risk management plan
ü Planning project expenses
ü Outsourcing/in-house allocations
ü Task advancement
ü Task postponement
ü Task allocation
ü Additional human resources recruitments
ü Human resources recruitments
ü Human resources dismissal
ü Risk recognition and deduction
ü Choosing technical alternative for project requirements implementation
ü Creating technical alternatives for project requirements implementation
ü Project additions and alterations management
ü Budget and cost management
C) How is the design in the software?
· Microsoft Project 2010: The design is fundamentally indeterminate! In fact, there is no pre-determined outcome. Instead of it, there is innovation, ideation and hypothesizing, fast-failing and iteration, and exploration of the boundaries and scopes/limits.
· Project Team Builder: The PTB design is realized to improve the project results. The design of the PTB supports the system engineering approach to problem solving as each scenario presents the requirements, the alternatives that can be selected and the constraints imposed on the solution.
D) Architectural overview, with diagrams, is available:
· Microsoft Project 2010: An architectural overview with diagram is not available
· Project Team Builder: Any architectural PTB overview with diagram is available
E) Descriptions of intended use cases are available and case studies are available:
· Microsoft Project 2010: On the Microsoft website the user can find lot of information and a folder containing several case studies already resolved. This functions offered by Microsoft can support the user in the use and resolution of his own project in the best way. However, the tool MSP has not got is having case studies inside the software itself.
· Project Team Builder: The Project Team Builder is based on a simulation of case studies. Each case study is a project or a collection of projects performed under schedule, budget and resource constraints, in a dynamic stochastic environment. The details of these case studies are built into the simulation and all the data required for analysis and decision-making is easily accessed by the user interface. A user-friendly case study generator facilitates the development of new case studies as required.
2. Documentation
A) Looking at the user documentation, what is its quality, completeness, accuracy, appropriateness and clarity:
· Microsoft Project 2010: It is considered one of the best software of Project Management for high quality of plan that it has been produced. MSP allows a fast task set up, an easy management of resources and it also allows keeping under control the conclusion of the projects. Furthermore, it allows us to resolve all kind of project management problems thanks to its integration with other tools.
Most of its users think MSP has high performance and ratio price-performance medium high. Softonic, one of the most famous software portals, evaluated MSP as a very complete tool for project management that permits to manage several projects in a flexible way. It is a referential software product for project managers. However, MSP can be still considered to be a complex and intricate tool, and for this reason it is appropriate only for expert users.
· Project Team Builder: Trainees success in the PTB simulation is determined by the quality of their decisions and the time required running the scenario. The quality of decisions is measured by the compliance with the required performance of the developed system, project duration and by the total project cost at the completion of the simulation.
B) The documentation provides a high-level overview of the software:
· Microsoft Project 2010: Project 2010 introduces a fresh, new interface that functions like its other Office product counterparts. And Project 2010 introduces two new views: the Timeline view and the Team Planner view.
The Task Driver feature has been expanded and renamed; it’s now the Task Inspector and it helps user to identify, quickly and easily, the scheduling factors that drive individual tasks, providing more information than the MSP version that was available before.
In MSP 2010, the user can make tasks inactive, keeping them in his schedule but eliminating their impact on the schedule. In both Project Standard and Project Professional, everyone can schedule tasks manually instead of having Project schedule them.
The Format tab enables each one to quickly and easily format any view.
· Project Team Builder: The PTB simulator for training project managers and system engineers improves the decision making process so that the results obtained at the end of the project are better in terms of cost, performance and duration.
C) The documentation is task-oriented:
a. Microsoft Project 2010: MSP is task-oriented. Task-oriented tabs and contextual menu groupings reveal powerful features.
b. Project Team Builder: PTB is not task oriented. The main goals support the user in the learning of project management skills and they can simulate several kinds of scenarios in a real environment.
D) Consists of clear, step-by-step instructions.
a. Microsoft Project 2010: The best way to learn how to use MPS is to study step by step each application on a book “Project 2010 Bible” by Elaine Marmel, Wiley publishing Inc. The book gives the opportunity to increase somebody’s own abilities from the beginning step.
b. Project Team Builder: PTB has an own guide but it doesn’t give to new user step by step information to resolve the problems that appear during the simulation. This is one of the most relevant differences with Microsoft Project 2010. Project Team Builder was born for an academic scope. The Biggest part of the users starts to work with PTB during its academic studies and its project management classes.
E) The documentation gives examples of what the user can see at each step e.g. screen shots or command-line excerpts.
a. Microsoft Project 2010
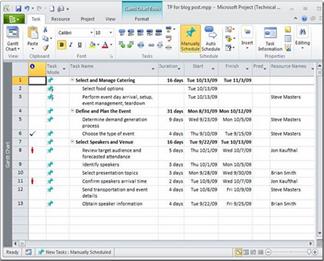
PICTURE n.2 Microsoft Project scheduling screen view
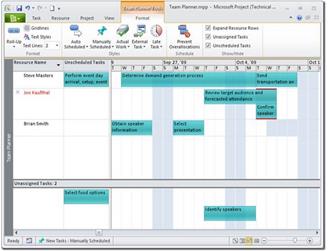
PICTURE n.3 Microsoft Project calendar screen view
b. Project Team Builder:
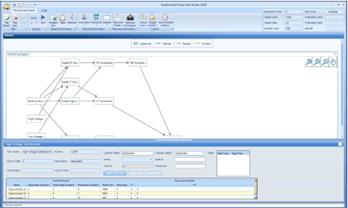
PICTURE n.4 Project Team Builder network screen view
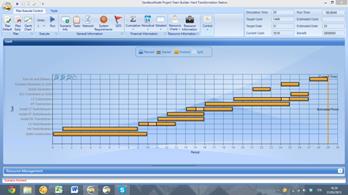
PICTURE n.5 Project Team Builder Gantt screen view
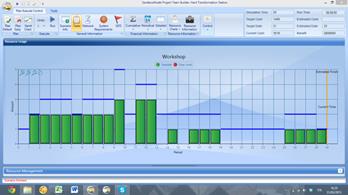
PICTURE n.6 Project Team Builder resources’ allocation screen view
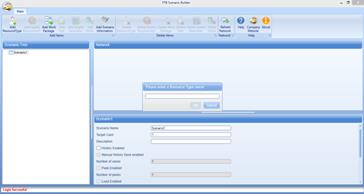
PICTURE n.7 Project Team Builder editor screen view
F) For problems and error messages, the symptoms and step-by-step solutions are provided:
a. Microsoft Project 2010: When a user, planning a project, has some problems, or it appears a box with an error message on the software’s screen, Microsoft Project gives the opportunity to the user to utilize and to research a possible solution on a complete guide. The guide is available online and it supports efficiently each user in order to solve any possible issue.
b. Project Team Builder: The PTB is a very helpful tool. During the building or simulation phases, if the user chooses an incorrect function, or if he tries to execute conflicted actions, on the screen a warning message in a box appears. PTB doesn’t suggest to users the correct solution to the problem that has been created, but it tries to advise the user there is something wrong in the choice taken. This element can be criticized because sometimes could be difficult for a new user to find the optimal solution or to follow the correct way.
G) The document uses teletype-style fonts for command line inputs and outputs, source code fragments, function names, class names, etc.
a. Microsoft Project 2010: The font of MSP 2010 is Calibri size 11
b. Project Team Builder: The font of PTB is Arial size 10,5
H) The documentation is on the project web site.
a. Microsoft Project 2010: On http://office.microsoft.com/en-us/project/, Microsoft website, are posted all the information necessary to use MSP. Also, the user can find there a support guide to resolve any kind of problem and a short presentation of the main feature of the software as well.
b. Project Team Builder: On the website http://www.sandboxmodel.com/ everyone can download PTB. To learn and to receive all information about the tool the user can buy a useful book, “Management Simulation with PTB Project Team Builder” by Avhram Shtub, which explains the easiest way that has to be followed in PTB.
Furthermore, the user can collect more information on PTB through several studies and academic researches, which are available on the web as well.
3. Buildability: Software and hardware requirements
c. Microsoft Project 2010: For basic use the user needs, at minimum, 64-bit editions of Windows Server 2008, Standard, Enterprise, or Data Center, Release 2 or later. To support Project Web App, we need Internet Explorer 7 or 8. Also, for the database engine, we need either SQL Server 2005 – SP3 CU4 or SQL Server 2008 RTM CU5. In addition, we would need to install the following components of the SQL Server:
i. Database Engine
ii. Analysis Services
iii. Reporting Services
iv. Management tools
v. Connectivity components, of which more information can be found on the Microsoft website (http://office.microsoft.com/project/).
d. Project Team Builder: The Project Team Builder is web based software; the only requirement for this tool is to be connected online to http://www.sandboxmodel.com/Run_PTB.html using Internet Explorer from a Windows computer.
4. Installability:
A) Website has instructions for installing the software:
e. Microsoft Project 2010: Microsoft through its website gives a great support to each new user that wants to start to use MSP. On the website the user can find all the informations that he needs. To install MSP is not easy. However, the necessary steps to install MSP right away are explained on the Microsoft website.
f. Project Team Builder: On the sandbox website there is only very short information about the steps to download the software. More information is included inside Mr. Shtub’s book. However, to use PTB, the user must download it before. To download PTB, he must get a username and password from sales@sandboxmodel.com. After obtaining a user name and password browse to http://www.sandboxmodel.com/Log_In.html and select “Run latest version of PTB”. Finally, when the PTB starts a tab appears and the user has to input his/her username and a password, and to click on OK to start using PTB.
B) Tests are provided to verify the installation has succeeded.
g. Microsoft Project 2010: The Microsoft website could be considered a good tutor that supports every person in the installation of the software. However, Microsoft team suggests hiring a Microsoft Project partner that assists the user in the installation and configuration process.
h. Project Team Builder: PTB has not an own web platform to support its users. If one of them has difficulty to install the tool he can contact the SandboxModel team by email. Briefly they provide help to resolve any kind of problems.
C) All GUIs contain a Help menu with commands to see the project name, web site, how/where to get help, version, date, license and copyright (or where to find this information), location of entry point into user doc., etc.
· Microsoft Project 2010: Yes, in the MSP we can find a new user interface:
i. Work more efficiently with the simple and intuitive Microsoft Fluent user interface: new graphical menus and a familiar experience provide the tools you need to plan and manage your project.
ii. Task-oriented tabs and contextual menu groupings reveal powerful features, making it easier to get started and obtain results.
iii. Quickly learn about features and rich formatting controls with descriptive tooltips and drop-down galleries.
iv. Simply be more productive by choosing your own menu options, quick access toolbar settings and setting defaults.
v. Save to XPS or PDF. Quickly share, print, and publish project information from one location using the new Microsoft® Office Backstag view.
· Project Team Builder: Yes, the tool has a Graphic User Interface (GUI). The PTB is designed as a teaching and training tool. As such, its (GUI) is friendly and easy to learn.
Although quite complicated scenarios can be simulated, and the decision support tools are sophisticated, a typical user can learn how to use the PTB within an hour.
5. Learnability
A) How straightforward is it to learn how to achieve basic functional tasks and advanced functional tasks
i. Microsoft Project 2010: To Learn MSP is not difficult. Online the user can find detailed guides that teach every kind of functional task that is present in MSP 2010. The tab below is only an example that explain a project basic task:
1. Start a new project
o Create a new project file
o Set the project start date
o Define the project calendar
2. Plan the tasks
o Enter tasks
o Decide how you want to schedule tasks
o Outline tasks
o Enter durations
o Link tasks to show relationships
o Create deliverables
3. Assign resources:
o Add resources to your project
o Assign resources to tasks
o Enter the work hours resources spend on tasks
o Know your task type
o Identify factors affecting task schedules
4. Set the project baseline
o Save the baseline plan
o View baseline data in a Gantt Chart view
o View baseline data in a table
5. Update progress
o Manage changes
o Track actual dates and durations
o Track actual hours and costs
6. View or report information
o Select a view
o Add a column
o Customize a view
o Print a view or report
o Generate a report
7. Close the project
o Create a final report
o Save a project as a template
j. Project Team Builder: A new user has not relevant problems to start to use PTB. The software is quite easy and the user after only few small hints by an expert user can try to practice the tools. PTB is not considered a complex tool and it allows improving user’s skills. The PTB learning is developed on the learning method known as “trial&error”. Using the software and trying several functions the new user can increase his/her own abilities and own knowledge. The abilities of each one increase step by step.
B) A getting started guide is provided outlining a basic example of using the software:
· Microsoft Project 2010: Yes, the MSP guide is done very well. Elaine Marmel in her book has collected several examples of possible scenarios that can appear with MSP. They help and support the user to learn and increase quickly each single topic.
· Project Team Builder: Yes, the Avhram Shtub’s guide is very helpful and it provides many examples that clarify the most important element to use the software in the best way.
C) Reference guides are provided for all command line, GUI and configuration options.
· Microsoft Project 2010: Yes. The command line of MSP looks like a command line of other office software, and in the guide it is explained in depth the meaning of each command and each instrument.
The interface of MSP is very friendly for users that usually work with software of the office packet, but it could be hard for an inexpert user. However, the online support is useful for them as well.
· Project Team Builder: Yes, inside the PTB book by Mr. Shtub the user can see several pictures and screen shots that show all functions of each instruments of the tool.
Sustainability and maintainability
1. Identify
B) To what extent is the identity of the software clear and unique both within its application domain and generally?
· Microsoft Project 2010: The main features that made unique MSP 2010 are:
i. Improved user interface: Project 2010 now includes the “ribbon” interface. Commands are organized in logical groups under tabs. The File tab takes the user to the new backstage feature, a one-stop graphical destination for opening, saving, and printing your files.
ii. New viewing options: Project 2010 includes several new views. A timeline view is automatically displayed above other views to show to users a concise overview of the entire project schedule. The new team planner view lets him quickly see what the team members are working on. Also, the tab for viewing and printing reports is easier to navigate with more options for visual reports.
iii. Manual scheduling: Project 2010 uses manual schedule as its default. MSP 2010 allows looking at Gantt bars to more clearly see how one version of a project differs from another version.
iv. Improved collaboration: Project 2010 is able to provide an interface with the most popular portals used in industry. Project now uses SharePoint instead of Project Web Access for collaboration. Project Server 2010 also provides integration with Microsoft Exchange 2010 to enable team members to manage and report on tasks directly from Microsoft Outlook. Remember that Project Standard does not include these collaboration features.
· Project Team Builder: The PTB is based on a simulation approach. The simulations are dynamic, and the real situation changes over time while running the scenario. A random effect is introduced to simulate the uncertainty in the environment. The user can plan the activities in different modes. The simulator also contains a model base with well-known models for scheduling, budgeting, resource management and monitoring and control. The PTB provides the ability to manage simultaneously several projects. These projects share the same resources and a common cash flow. From the Graphic User Interface perspective, the simulator is user friendly and easy to learn. Integration with commercial project management tools let the users analyze the scenario on the commercial project management software and support the decisions with tools that are actually used in his organization.
The PTB is unique because is designed as a teaching tool and as a decision support system for project managers and their teams.
C) Project/software has its own a logo:
· Microsoft Project 2010: The logo of MSP is:

· Project Team Builder: The logos of PTB are

D) The Software has a distinct name within its application area. A search by Google on the name plus keywords from the application area throws up the project web site in the first page of match:
· Microsoft Project 2010: The name of the software is a distinct name. If you research MSP 2010 on Google in the application area, the server highlights every time the entire name of the software: Microsoft Project.
· Project Team Builder: The name of the software is not a distinctive name. PTB does not appear in any of the top links after being browsed on the Google research engine. Also, PTB is recent, and not a commercial software. It is considered unique for its main characteristics but it is not well known in the project manager’s community.
E) Project/software name is trade-marked.
· Microsoft Project 2010: MSP belongs to Microsoft’s family. The name Microsoft is synonymous for high-quality computer software and hardware products, as well as services. Microsoft trademarks are extremely valuable because they represent the standards of excellence and consistent quality associated with Microsoft. For this reason it can be affirmed that MSP 2010 is trademarked.
· Project Team Builder: The PTB name is not a trade market. This acronym is used in several fields to express different meanings. For this reason we can consider the name of PTB as not univocal.
2. Community: To what extent does/will an active user community exist for this product?
· Microsoft Project 2010: Microsoft offers to its users that work with its software, in this case MSP, the possibility to share their opinions, doubts or problems through the Microsoft community. The Microsoft Community connects with customers and experts to get answers, share tips and find solutions. Additional communities, in the list below, are available for Developers, IT Professionals and Consumers, and Home Users:
§ Technet Forum for IT Professionals
The user can also select one of the communities based on a single product or technology.
In reality, two different kinds of communities exist, one is composed by technician, and the second one is for the members of the community. The user has the possibility to access to both of them, and to choose which one is better for his needs.
· Project Team Builder: PTB has not an own community.
3. Accessibility: What are the extents for accessibility?
· Microsoft Project 2010: Microsoft is committed to making its products and services easier for everyone to use. Many accessibility features are built right into Project. These features are available to everyone, without the need for additional accessibility aids.
Project supports accessibility with the exceptions noted:
i. Keyboard accessibility
ii. High contrast and display attributes
· Project Team Builder: The PTB accessibility features are available for every person who wants to use the tool. In order to download PTB the user has to look for the SandboxModel website on the Windows explorer browser, using a Windows computer. These are the only existing limitations when using and downloading PTB.
4. Analyzability: How straightforward is to analyze the software’s source release in order to understand and evaluate the software?
· Microsoft Project 2010: Microsoft gives the opportunity to analyze and to study every features of its product through an online guide. It deals with every single element of the software. For inexpert users it is very easy to find there all the information that they need to resolve different problems. The guide of MSP in particular, is very useful and complete. It is an important instrument because it simplifies each function of this complex tool.
Furthermore, Microsoft supports the user with its online community. It helps him to find the best answer to his researches and his needs.
· Project Team Builder: It is very difficult to analyze the PTB software. The biggest part of the PTB’s information found on the web is not public. For a new user it could be difficult to find deep and clear information about the software. It is very complicated to identify the technical features of PTB. However, the tool’s guide, written by the Technion professor Mr. Avhram Shtub, gives the most relevant suggests. It allows the user to have the opportunity to understand and to learn every single step of the tool, and to be able to finish every project. Only by trying the tool, the user can analyze and evaluate the performance of the software.
5. Evolvability: Roadmap of the software, what is its history and what is its future
· Microsoft Project 2010: MSP 2010 continues the evolution and is arguably the most significant release of Project in over a decade. Project 2010 delivers new and innovative capabilities across the Microsoft Project family of products: Project Server 2010, Project Professional 2010, and Project Standard 2010. MSP 2010 continues to evolve in order to meet the changing collaboration and project management needs within organizations of all sizes. At the heart of that evolution is Microsoft’s focus on an integrated platform wherein customers are better able to respond to industry trends and have an opportunity to realize the benefits of Project Portfolio Management (PPM) beyond IT and into all areas of a business.
The customers value MSP 2010 as one of the best Microsoft products for its improved integration and continuous innovation with Microsoft technologies. Furthermore, they can use Microsoft Project to manage all their work from the simplest to the most complex projects.
· Project Team Builder: The Sandboxmodel is working on PTB in collaboration with Technion University. It has many plans for development of the tool. They already developed a "Light" version of the PTB for beginners. This version is very easy to be used and requires no time to be learnt. They are also working on more advanced features, such as multi user, advanced simulations, or "solver" algorithms.
L. Interoperability: Interoperable with other required/related software
· Microsoft Project 2010: Microsoft Project's capabilities were extended with the introduction of Microsoft Office Project Server and Microsoft Project Web Access. Project Server stores Project data in a central SQL-based database, allowing multiple, independent projects to access a shared resource pool. Web Access allows authorized users to access a Project Server database across the Internet, and includes timesheets, graphical analysis of resource workloads, and administrative tools.
· Project Team Builder: Currently the user can import and export from Microsoft Project to PTB. This is the most important interoperability function. The outcome is not precise as the PTB takes into consideration information that MS Project ignores (variability, modes of execution). Also, the PTB has an interface with other third party tools.
3.2.2 Educational software evaluation
To complete the examination of Project Team Builder, and Microsoft Project, a second and different analysis method is chosen. The second criteria are born from a research study in 1993. In this work, four main points to evaluate the software products from an educational point of view have been identified. The method of evaluation for teaching and learning software can be summarized with two adjectives: formative and summative. Formative methods are used when a project’s outline has been decided and work has begun on the design and development of the various parts. It can be deliberate and it consists of a series of methods to determine whether the project can work as planned or it can be so ad hoc that it consists mainly of obtaining the opinions of passer-by as to the visual effectiveness of a series of screens.
In comparison summative evaluations can be much wider in scope. They occur when the finished product is examined and can benefit from hindsight.
To a good evaluation a simple question for any educational software should be done: “Can this product actually teach what it is supposed to?” It is a simple question to ask, but often difficult to answer, since the product may have so many appealing features. It requires the evaluator to recognize his/her own view of the ways in which students learn to relate that view to the learning objectives of that portion of the course and to determine how and whether those objectives are carried out in the software.
Barker and King in 1993 have developed a method for evaluating interactive multimedia courseware. They provide four factors which their research suggests are of key importance to successful products. Below there is the list of these important elements.
I. Quality of end-user interface design: Investigation shows that the designers of the most highly-rated products follow well-established rules & guidelines. This aspect of design affects user perception of the product, what they can do with it and how completely it engages them.
· Project Team Builder: Project Team Builder is characterized by an easy and simple graphical user interface (GUI), a type of user interface that allows users to interact with electronic devices through using images rather than text commands. Seven important element of PTB interface can be highlighted:
I. Suitability for the task: the dialogue is suitable for a task because it supports the user in the effective and efficient completion of the task.
II. Self-descriptiveness: the dialogue is self-descriptive because each dialogue step is immediately comprehensible through feedback from the system and it is explained to the user on request.
III. Controllability: the dialogue is controllable because the user is able to initiate and control the direction and pace of the interaction until the point at which the goal has been met.
IV. Conformity with user expectations: the dialogue conforms with user expectations because it is consistent and corresponds to the user characteristics, such as task knowledge, education, experience, and to commonly accepted conventions.
V. Error tolerance: the dialogue is error tolerant because despite evident errors in input, the intended result may be achieved with minimal action by the user.
VI. Suitability for individualization: the dialogue is capable of individualization because the interface software can be modified to suit the task needs, individual preferences, and skills of the user.
VII. Suitability for learning: the dialogue is suitable for learning because it supports and guides the user in learning to use the system.
· Microsoft Project 2010: MSP 2010 offers an intuitive and familiar interface so the user can get set up and get going. MSP 2010 is designed to work more like other Office 2010 applications, which means efficiency and simplified project management for the user. MSP 2010 offers the flexibility and choice that supports the way the project manager likes to work. Microsoft has discovered which commands people use most, the sequence in which people commonly use commands, and which commands users typically access through the toolbar, mouse, or keyboard. Based on that research, it made commands easier to find in MSP 2010. This gives the user a better experience and helps him get more done in less time. The fluent user interface makes finding and using a favorite tool project easier. With solution-oriented tabs for managing projects, resources, and tasks, commands and features that were previously configured in more complex menus have been brought to the surface for easy use. In Project 2010, contextual tabs provide formatting options and show available actions based on the view or item selected. Context-sensitive actions are grouped so the user can easily find and choose the right command. Relevant actions are presented so he can complete his work quickly without navigating through multiple menus.
II. Engagement: Appropriate use of audio & moving video segments can contribute greatly to user motivation in working with the medium.
· Project Team Builder: Project Team Builder is a web based simulator software product. The simulation is one of the best solutions to maintain high the student engagement, as it is shown in several recent researches. We could state that PTB is a demanding software product since it tries to simulate a real project in real world. PTB is interactive software; the tool supports the user to find optimal solution but it does not give the solutions. Also, PTB can be used by team, and as shown by Davidovich’s studies, the teamwork with PTB increases the learning in individual persons, thanks to the higher individual engagement in a team.
· Microsoft Project 2010: This tool has a configuration standard. The more dynamic new interface in MSP 2010 has allowed the increase of engagement of the user, but the huge number of functions and way to resolve the same problem make the learning of the software for the new users, and for the students, hostile.
III. Interactivity: Users’ involvement in participatory tasks helped to make the product meaningful and to provoke thought.
· Project Team Builder: As mentioned before, PTB is a simulator software product. Simulations and modeling tools are the best examples of complex and meaningful interactivity. The user is completely involved in the use of the tools, and the simulation is one of the best ways to learn and increase skills. After one hour the new user can start to work and to project in PTB without any problems, but he cannot achieve the optimal performance so soon.
· Microsoft Project 2010: It is linear and complex software developed for project management. Its main goal is to support the project manager in managing every phase of the project. It is also used at the university to teach the basic skills of the project management. It is not interactive software because it does not allow a direct communication between user and machine.
IV. Tailorability: Products which allow users to configure the software products and change them to meet particular individual needs and to contribute well to the quality of the educational experience.
· Project Team Builder: It is developed to support and teach new users in managing difficult engineering projects. It is developed to support the teaching of project management skills. The software configurations are changed in the several versions in order to improve the performance of the software and to increase the teaching abilities.
· Microsoft Project 2010: As previously explained this software is developed by Microsoft to meet needs of Project Managers and Companies. In fact, its first scope is not to educate or to teach. MSP 2010 is one of the most common project management software. It is also used in different university classes to support the student in the learning of the project management skills. The different versions of Microsoft Project are developed to increase the performance of the project management work. MSP cannot be considered as educational software, however, it can be used as a good support for the teaching of project management abilities as well.
4. Research Questions and Hypothesis
The preliminary literature research has allowed individuating two questions and hypothesis for the following research.
The aim of this work is finding the answers to the questions below:
Q1: How can we increase and improve the PTB final performance?
Q2: Is the combination of MSP and PTB the best solution to improve the results in the planning?
To answer to the previous demand we have identified two hypotheses that are reported here:
H1: PTB has different ways to improve its abilities and potentiality
H2: The combination of PTB and MSP is unique and makes the management of complex engineering projects easier
This research is based on three methodologies of work. All of them are used in testing the research hypotheses:
I) The design of experiment (DOE)
J) Training through workshop
K) Questionnaire
The three different methodologies have been the base of the quantitative and the qualitative analysis for this research.
We have chosen to adopt a mixed research method because it allows a complete study of the problem.
Mixed research is a general type of research (it’s one of the three paradigms) in which quantitative and qualitative methods, techniques, or other paradigm characteristics are mixed in one overall study.
Mixed method research is a research in which the researcher uses the qualitative research paradigm for one phase of a research study and the quantitative research paradigm for another phase of the study. For example, a researcher might conduct an experiment (quantitative) and after the experiment conduct an interview study with the participants (qualitative) to see how they viewed the experiment and to see if they agreed with the results.
Perhaps the major goal for researchers who design and conduct mixed research is to follow the fundamental principle of mixed research. According to this principle, the researcher should mix quantitative and qualitative research methods, procedures, and paradigm characteristics in a way that the resulting mixture, or combination, has complementary strengths and non-overlapping weaknesses. The use of multiple methods or approaches to research works the same way. When different approaches are used to focus on the same phenomenon and they provide the same result, you have "corroboration", which means you have superior evidence for the result. Other important reasons for doing mixed research are to complement one set of results with another in order to expand a set of results, or to discover something that would have been missed when using only a quantitative or a qualitative approach. Some researchers like to conduct mixed research in a single study, and this is what is truly called mixed research. However, it is interesting to note that virtually all research literatures would be mixed at the aggregate level, even if no single researcher uses mixed research. That's because there will usually be some quantitative and some qualitative research studies in a research literature.
Accordingly with the advantage of mixed method research, in collaboration with the Industrial and Management Engineering Department of the Technion Israel Institute of Technology, for this work we have designed two different experiments.
The aim of the two experiments was to identify the top solutions to starter questions that I listed in chapter 4.
5. Quantitative research
The quantitative research refers to the systematic empirical investigation of social phenomena via statistical, mathematical or computational techniques. The objective of quantitative research is to develop and employ mathematical models, theories and/or hypotheses pertaining to phenomena. The process of measurement is central to quantitative research because it provides the fundamental connection between empirical observation and mathematical expression of quantitative relationships. Quantitative data is any data that is in numerical form, such as statistics, percentages, etc. This means that the quantitative researcher asks a specific, narrow question and collects a sample of numerical data from participants to answer the question. The researcher analyzes the data with the help of statistics. The researcher is hoping the numbers will yield an unbiased result that can be generalized to some larger population.
Quantitative research is generally made using scientific methods, which can include:
· The generation of models, theories and hypotheses
· The development of instruments and methods for measurement
· Experimental control and manipulation of variables
· Collection of empirical data
· Modeling and analysis of data
5.1 The experiment
This first experiment is designed to collect different data for a quantitative analysis. It has been realized by the Industrial and Management Engineering of Technion Israel Institute of Technology at Haifa.
The experiment wants to investigate which is the best way to plan a complex project using three different methodologies:
- Planning with Microsoft Project 2010 (MSP)
- Planning with Project Team Builder (PTB)
- Planning with MSP&PTB
The test is divided in two parts.
In the first part the Design of Experiment is realized in collaboration with the Statistical Department of Technion in order to guarantee the validity and the goodness of the final results. This section is composed by three different steps of data collection, one for every kind of planning. The values accumulated will be used to compare the three alternatives. Along this line it will be possible to define the best methodology for the planning.
The second part of the experiment collects information about the personal experience of the subjects related to their use of PTB. These data will be compared with the perceptions of another sample of subjects with a different background. The second group chosen for the analysis is a group of students from the Management and Industrial Engineering Department.
The comparison allows analyzing the software from different points of views and finding new improvements to increase its final performance.
5.2 Research Questions and Hypotheses
The experiment wants to answer to three questions:
Q1: What is the best solution in the project planning phase among PTB, MSP or PTB&MSP?
Q2: Are there projects with large standard deviation and are there projects with big reduction?
Q3: Does a difference in the feelings and in the experience in students with different background exist?
The hypotheses that have been considered in order to find the answer to the first questions are:
H1: The combination between PTB and MSP is the best choice in the phase of planning in complex engineering projects.
H2: Students with different academic backgrounds have different feelings and different opinions about PTB
The preliminary considerations that have just been taken are tested with two methodologies:
- The design of experiment (DOE): the DOE describes the steps that will be followed to collect all the data analysis during the test. The Industrial and Management Engineering Department, in order to guarantee the goodness and the validity of the final results of every test, usually realizes its own experiments in collaboration with the faculty of Statistic of the Technion Israel Institute of Technology.
- Training through workshop: the phase of workshop is composed by two parts: lectures and real work. The students have to realize a real project scenario during their course. The main goal of their project will be optimizing the performance of their scenario in terms of cost and duration.
5.3 Research Method
The experiment is divided in two sections. The tab below recaps the main features of each part.
|
NAME |
GOAL |
PARTICIPANTS |
METHODOLOGY |
DATA ANALYSIS |
|
PART1 |
H1 |
36 students of the Faculty of Computer Science divided in 12 groups of 3 people. Every member of the group has a specific role. There are 3 roles: - Project Manager (PM) - Service Engineer (SE) - Quality Analyst (QA) |
Collect data of duration and cost with the final grades at the end of each step |
- Identification of standard deviation and reduction in the different steps of the experiments - Comparison of the results - Plotting of the results to underline the presence of trend |
|
PART 2 |
H2 |
36 students of the Computer Science Department 15 students of the Industrial and Management Engineering Department |
Questionnaire |
Comparison of the different experience of students with a different academic background |
CHART n. 4 research method chart
5.3.1 Research Map
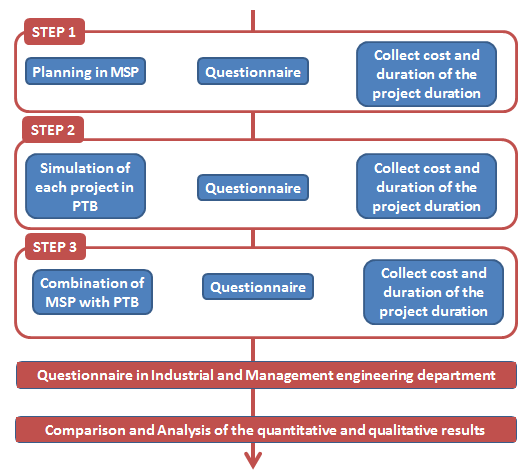
PICTURE n.8 research map of the experiment 1
5.4 Details of the Design of the Experiment
The experiment aims to evaluate the best choice among PTB, MSP, or the combination between PTB and MSP, for planning and scheduling of complex engineering projects.
5.4.1 The Measurements
The tools used for the experiment are:
- Microsoft Project 2010 (MSP): It is a project management software program, designed to assist a project manager in developing a plan, assigning resources to tasks, tracking progress, managing the budget, and analyzing workloads.
- Project Team Builder: It is a project management tool developed for training and teaching the concepts of project management and for improving project decision making.
- Jump (JMP): It is a computer program for statistics developed. It is focused on exploratory data analysis and visualization. It is designed for users to investigate data to learn something unexpected, as opposed to confirming a hypothesis.
- Questionnaire: The questionnaire that will be used during the experiment is attached in the appendix. It allows making a comparison and an evaluation for the three different alternatives of planning. This choice guarantees a different point of view of the problem.
5.4.2 The Participants
The subjects of the experiment are of two types.
· TYPE 1: The first part of the test is based on the experience of 38 students of the faculty of computer science. These students have followed a project management class. Also, the students have the same academic background and their abilities are homogeneous.
They have been divided in 12 groups of 3 people and 1 group of 2 people.
Every member of the group has a specific role in the project. The roles assigned in each group have the same functions of a real project team. The three characters are:
o Project Manager (PM): Project managers can have the responsibility of the planning, execution and closing of any project, typically relating to construction industry, architecture, Aerospace and Defense, computer networking, telecommunications or software development.
Many other fields in the production, design and service industries have project managers as well.
o System Engineer (SE): Systems engineering is a highly hands-on role. The systems engineer helps a company develop and maintain the many different technical components that make up a system.
o Quality Analyst (QA): The Quality Analyst will participate in the development phase of a project to verify the form and function of solutions. He writes efficient plans and test cases that exercise all logic paths. He uses testing tools to enhance the efficiency and effectiveness of the testing environment. He coordinates test execution, document and disseminates test results. He analyzes results and improves future testing iterations and uses statistics for basis of conclusions.
The choice to gather the 38 students in 13 different groups have been made by Davidovich, Nembhard and Shtub study (2009) on the benefit of the teamwork in the learning of project management skills with PTB.
The study summarized in the article “Comparing competitive and cooperative strategies for learning project management” indicates that cooperation is a favorable strategy in learning. Competition overall showed marginally greater improvement (learning), although the cooperation strategy significantly dominated that of competition. It was also noted that the cooperative strategy was actually only significantly better than the other strategies for the low performer of the pair.
Other previous studies of Sherman and Johnson support the conclusion that cooperation is preferred for the training.
TYPE 2: The second group is composed by 15 students that attended a project management course in the faculty of Industrial and Management Engineering.
5.4.3 The Experiment procedure
This section provides the description the method followed to complete the experiment.
The test procedure is sequential. It is required that every single phase is closed before the next phase starts.
5.4.3.1 STEP 1: Planning with MSP
Before the experiment’s start we have divided the subjects in groups. In particular, the students of the project management’s class in the Computer Science department are gathered in 13 groups.
There are three people in each group.
As previously described, each member of the group covers a specific role in the project. Every student, into his group, is a Project Manager, System Engineer, or a Quality Analyst.
In the first step of the experiment we have asked each group to plan their own project on Microsoft Project. The software program was taught in several lectures during the course of Project Management.
The students’ projects diverge only for few characteristics, but they have the same milestones, and they follow a similar structure as well.
The projects are constituted by a minimum of 6 and a maximum of 8 tasks. Every group was free to choose the best number and typology of resources.
I considered one of the projects, the eAutoRepair project, as example to simplify and clarify the experiment.
The project is composed by seven different tasks:
1. Project Management & Control
2. Analysis & Design
3. Implementation, Integration & Testing
4. System Integration and Testing
5. Customer Support
6. Training
7. Warranty & Maintenance
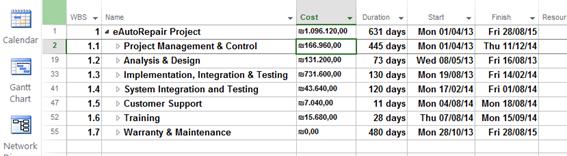
PICTURE n.9 WBS of the project
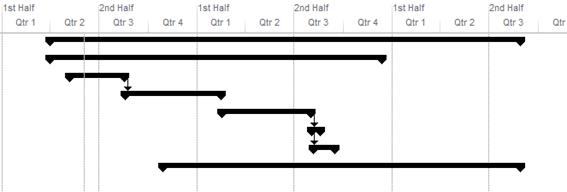
PICTURE n.10 Gantt Diagram

PICTURE n.11 resources usage
At the end of the scheduling and planning phase with Microsoft Project, we have asked the students to fill a “questionnaire”, which is attached in the appendix at the end of the paper (Appendix A). The students have expressed their opinions and their feelings about their experience with MSP.
In the questionnaire they answered to 10 questions and they indicated the final duration and cost of the project at the end of the scheduling phase.
5.4.3.1 STEP 2: Planning with PTB
In the second step of the experiment we have asked the students to simulate their project on PTB.
Furthermore, I built on PTB Scenario Builder the 13 different scenarios. I simplified the original projects, and I considered the same hypothesis for all the scenarios, to guarantee the homogeneity among all projects.
I gathered the different workers and resources in 3 clusters:
- Project Management and Team Leader
- Managers
- Engineers
I defined and I added for each resource more information. This information are necessary to complete and evaluate the final cost of the project at the end of the simulation. Therefore I determined:
- The resources ‘default number
- The idle cost for each resource: 50% of the assigned price in MSP scheduling
- Arrival probability: 90%
- Release price:
o 50 for the Project Management,
o 30 for the Managers
o 25 for the Engineers
- Maximum number of resources for units
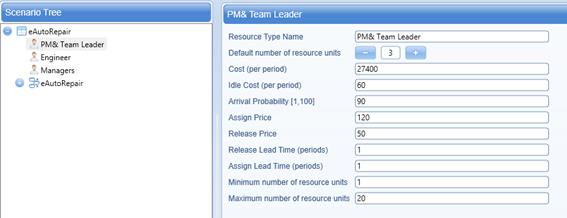
PICTURE n.12 Resources Type
Furthermore I built all the projects’ tasks on PTB. To guarantee the homogeneity of each scenario I considered the same hypothesis:
- Income for each task: 20% more than the cost of the task on MSP. The Project Management & control, the training and warranty tasks do not have an income.
- The split cost equals to 20
- Three different modes. Each mode represents an alternative to perform a task.
o Contract A: it is the mode defined by the students in their planning on Microsoft Project
o Contract B or Outsourcing. The task costs 10% more than the cost of the contract A, the duration is 10% less than the duration of contract A, and the number of resources/workers to complete the task is 30% less since the reaming part is outsourcing
o Contract C: the task can be performed by less resources/workers. The cost is 10% less than cost of contract A, the duration is 10% more than the duration of contract A, and the number of resources is the 40% less.
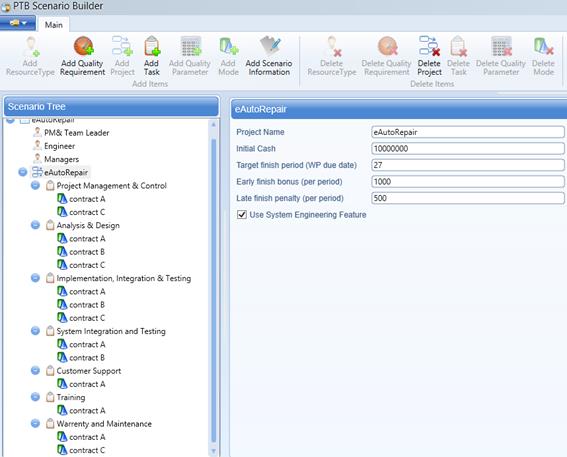
PICTURE n.13 project informations
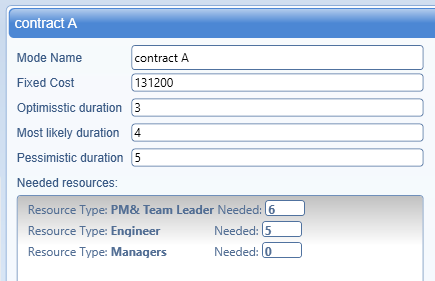
PICTURE n.14 Contract A
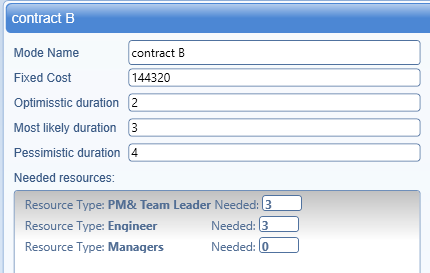
PICTURE n.15 Contract B
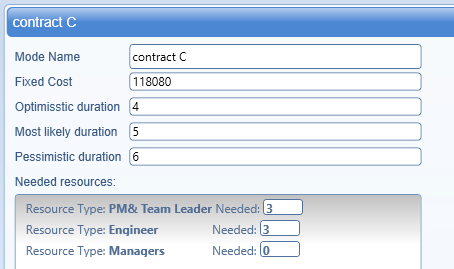
PICTURE n.16 Contract C
Once all scenarios have been completed I tested all of them three times on the PTB simulator in order to verify the accuracy of the data.
Completed this initial phase I asked to each group to run its own project on the PTB simulator.
At the end of the simulation each student filled a questionnaire about his feelings and considerations about this experience. In the document they indicated the final duration and cost of the simulation.
5.4.3.2 STEP 3: Combination of PTB and MSP
At the end of the simulation on PTB the third phase of the experiment starts. In this part every group can change their starting decision made in step 1 during the planning on MSP (is it correct).
When the students terminate their simulation they can export the information and the final results of the simulation on MSP.
They can modify their scheduling and their first decisions, and finally they can run the new planning on PTB simulator and so to verify the final results on duration and cost.
At the end of this step I asked them to fill a new questionnaire to evaluate their new opinion and feelings about the last experience.
5.4.3.3 STEP 4: Collect data and statistical analysis
We collected and analyzed all the results at the end of each step of the experiment.
We gathered the values of duration and final cost in the three phases for a statistical analysis. I used statistical software, JUMP, to support the analysis.
Additionally, I calculated the standard deviation, average and reduction of the final scores among each step.
At the end of the statistical analysis I could complete the evaluation of the two tools, Project Team Builder and Microsoft Project.
5.4.3.4 STEP 5: Comparison of questionnaire
Concluded the statistical analysis we proposed the same questionnaire used during the whole experiment to students of the Industrial and Management Engineering Department. The data of the two questionnaires have been used to evaluate the performances of the PTB simulators. The comparison allows the evaluation of the performance’s tool from two completely different points of view.
5.4.3.5 STEP 6: Discussion and conclusions
This phase is reserved for the conclusions of the results obtained.
5.5 Data Analysis
The data analysis started with the choice of the quantitative technique. This method has been used in the following steps to evaluate information collected during the experiment.
Quantitative techniques may be defined as those techniques which provide the decision makes a systematic and powerful means of analysis, based on quantitative data. It is a scientific method employed by the management for problem solving and decision making. With the help of quantitative techniques, the decision maker is able to explore policies for attaining the predetermined objectives. In short, quantitative techniques are inevitable in the decision-making process.
There are different types of quantitative techniques. We can classify them into three categories. They are:
1. Mathematical Quantitative Techniques: A technique in which quantitative data are used along with the principles of mathematics is known as mathematical quantitative techniques. Mathematical quantitative techniques involve:
· Permutations and Combinations: Permutation means arrangement of objects in a definite order. The number of arrangements depends upon the total number of objects and the number of objects taken at a time for arrangement.
· Set Theory: Set theory is a modern mathematical device which solves various types of critical problems.
· Matrix Algebra: Matrix is an orderly arrangement of certain given numbers, or symbols, in rows and columns. It is a mathematical device of finding out the results of different types of algebraic operations on the basis of the relevant matrices.
· Determinants: It is a powerful device developed over the matrix algebra. This device is used for finding out values of different variables connected with a number of simultaneous equations.
· Differentiation: It is a mathematical process of finding out changes in the dependent variable with reference to a small change in the independent variable.
· Integration: Integration is the reverse process of differentiation.
· Differential Equation: It is a mathematical equation which involves the differential coefficients of the dependent variables.
2. Statistical Quantitative Techniques: Statistical techniques are those techniques which are used in conducting the statistical enquiry concerning to certain Phenomenon. They include all the statistical methods beginning from the collection of data till interpretation of those collected data. Statistical techniques involve:
· Collection of data: One of the important statistical methods is collection of data. There are different methods for collecting primary and secondary data.
· Measures of Central tendency, dispersion, Skewness and Kurtosis. Measures of Central tendency are a method used for finding the average of a series, while measures of dispersion are used for finding out the variability in a series. Measures of Skewness estimate asymmetry of a distribution, while measures of Kurtosis determine the flatness of peakedness in a distribution.
· Correlation and Regression Analysis: Correlation is used to study the degree of relationship among two or more variables. On the other hand, the regression technique is used to estimate the value of one variable for a given value of another.
· Index Numbers: Index numbers measure the fluctuations in various Phenomena like price, production, etc. over a period of time. They are described as economic barometers.
· Time series Analysis: Analysis of time series helps us understanding the effect of factors which are responsible for changes.
· Interpolation and Extrapolation: Interpolation is the statistical technique of estimating under certain assumptions, the missing figures which may fall within the range of given figures. Extrapolation provides estimated figures outside the range of given data.
· Statistical Quality Control: Statistical quality control is used for ensuring the quality of items manufactured. The variations in quality, because of assignable causes and chance causes, can be known with the help of this tool. Different control charts are used in controlling the quality of products.
· Ratio Analysis: Ratio analysis is used for analyzing financial statements of any business or industrial concerns which helps to take appropriate decisions.
· Probability Theory: Theory of probability provides numerical values of the likelihood of the occurrence of events.
· Testing of Hypothesis: Testing of hypothesis is an important statistical tool to judge the reliability of inferences drawn on the basis of sample studies.
3. Programming Quantitative Techniques: Programming techniques are also called operations research techniques. Programming techniques are model building techniques used by decision makers in modern times. Programming techniques involve:
· Linear Programming: Linear programming technique is used in finding a solution for optimizing a given objective under certain constraints.
· Queuing Theory: Queuing theory deals with mathematical study of queues. It aims at minimizing cost of both servicing and waiting.
· Game Theory: Game theory is used to determine the optimum strategy in a competitive situation.
· Decision Theory: This is related to making sound decisions under conditions of certainty, risk and uncertainty.
· Inventory Theory: Inventory theory helps in optimization of the inventory levels. It focuses on minimizing costs associated with holding of inventories.
· Network programming: It is a technique of planning, scheduling, controlling, monitoring and coordinating large and complex projects including a number of activities and events. It serves as an instrument in resource allocation, and adjustment of time and cost, up to the optimum level. It includes CPM, PERT etc.
· Simulation: It is a technique of testing a model which resembles a real life situation.
· Replacement Theory: It is concerned with the problems of replacement of machines, etc. due to their deteriorating efficiency or breakdown. It helps to determine the most economic replacement policy.
· Non Linear Programming: It is a programming technique which involves finding an optimum solution to a problem in which some or all variables are non-linear.
· Sequencing: The sequencing tool is used to determine a sequence in which given jobs should be performed by minimizing the total efforts.
· Quadratic Programming: The quadratic programming technique is designed to solve certain problems, the objective function of which takes the form of a quadratic equation.
· Branch and Bound Technique: It is a recently developed technique. This is designed to solve the combinational problems of decision making where there are large numbers of feasible solutions. Problems of plant location, problems of determining minimum cost of production etc. are examples of combinational problems.
The statistical analysis of the data has been realized with the statistical software JUMP (JMP).
JMP is a computer program for statistics developed by the JMP business unit of SAS Institute. It was created in the 1980s to take advantage of the graphical user interface introduced by the Macintosh. It has since been improved and made available for other operating systems. JMP is used in applications such as Six Sigma, quality control and engineering, design of experiments and scientific research.
The software is focused on exploratory analytics, whereby users investigate and explore data, rather than to confirm a hypothesis.
The JMP software is designed for users to investigate data in order to learn something unexpected, as opposed to confirming a hypothesis. JMP links statistical data to graphics representing them, so users can drill down, or up, to explore the data and various visual representations of it.
After the choice of the method and the tools to support the statistical analysis of the data, I tried to find a technique to classify the different projects depending on their complexity.
There are no formal definitions to classify projects in terms of size or complexity.
I examined the different projects and I tried to build a common algorithm to classify the complexity of the projects grounding on the same characteristics.
Complexity of the project = n° task *2 + critical path*3 + n° network connections*1 + n° resources*2
In the above formula, I identified the most important features for each project and I gave them a different weight.
- Number of task: it is the number of projects’ tasks into PTB scenario
- Critical paths: it is the duration in months of the critical path. I calculate the longest duration that we have into PTB scenario.
- Network connection: it is number of connection that we need to link all the tasks in PTB scenario
- Number of resources: it is the total number of resources in the PTB scenario that we need in order to perform all the tasks.
I have assigned the different weights to each element basing on the influence and the importance of each feature in the performance of the projects.
At the end I have calculated the complexity grade for each project and I have created a list with all the groups.
|
N° |
name |
n° task |
critical path duration |
n° connection |
resource 1 |
resource 2 |
resource 3 |
max n° resources |
grade |
||
|
2 |
ePsychInstitution |
8 |
56 |
8 |
3 |
5 |
3 |
11 |
214 |
||
|
3 |
eTraffic |
6 |
46 |
5 |
3 |
4 |
2 |
9 |
173 |
||
|
11 |
eBus |
8 |
37 |
9 |
5 |
6 |
6 |
17 |
170 |
||
|
10 |
RentMe |
8 |
37 |
7 |
2 |
3 |
4 |
9 |
152 |
||
|
1 |
Softwarehouse |
6 |
34 |
5 |
2 |
3 |
9 |
14 |
147 |
||
|
8 |
eFlower |
7 |
30 |
9 |
1 |
2 |
4 |
7 |
127 |
||
|
4 |
Hitcvh2 |
7 |
28 |
6 |
3 |
4 |
3 |
10 |
124 |
||
|
5 |
eAutoRepair |
7 |
21 |
5 |
4 |
3 |
5 |
12 |
106 |
||
|
7 |
eTicket |
8 |
19 |
8 |
1 |
5 |
3 |
9 |
99 |
||
|
6 |
iNuke |
6 |
18 |
4 |
2 |
3 |
3 |
8 |
86 |
||
|
9 |
eWall |
5 |
14 |
6 |
3 |
3 |
4 |
10 |
78 |
||
|
12 |
eLunch |
6 |
14 |
5 |
3 |
2 |
3 |
8 |
75 |
||
CHART n. 5 list of project’s complexity
The chart shows that the group 2, with a grade of 214, has the most complex project. The project ePsychInstitution is the longest project and it has the maximum number of tasks. The group number 12, eLunch has the easiest project with a grade of 75.
Completed this significant preliminary evaluation I started the statistical analysis of the data, as well as the comparison and analysis of the projects’ results.
Moreover, I began with the evaluation of the student’s answer.
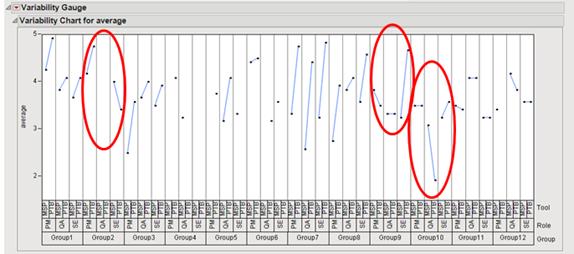 PICTURE
n.17 variability of answers ‘average
PICTURE
n.17 variability of answers ‘average
The chart that follows represents the average of the answers to the questionnaire given by each single student from each different group and from each role and project of which that group was part of. In fact, to be more precise, the point on the left part of each column of the chart corresponds to the average of the answers related to the specific phase of the experiment with Microsoft Project. Furthermore, the second point from the top, on the right side of each column, represents the average of the answers the students provided after their experience with Project Team Builder. We can see that the students of the groups 2, 9 and 10, marked with the red circle, exhibited the most significant results.
However, the students that belonged to the same group and worked on the same project expressed contradictory opinions about their experience with Microsoft Project and Project Team Builder during the experiment.
The steps that follow try to clarify the reasons of these opposite results.
I have analyzed the results of each project in order to find the answers to the just mentioned issue. The second chart below shows the average for cost and duration for each project divided into the two software products: MSP and PTB.
![]()
![]()
![]()
![]()
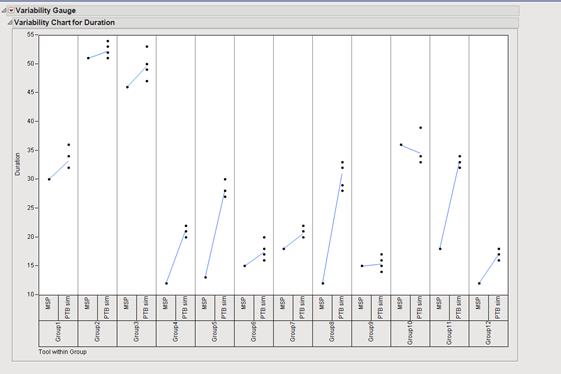
PICTURE n.18 variability of projects’ duration
![]()
![]()
![]()
![]()
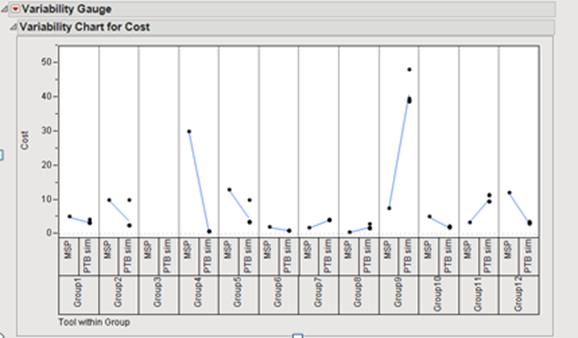
PICTURE n.19 variability of projects’ cost
The charts highlight relevant and significant features. I marked them with colored circles:
- The group number 2 is the group with the most complex project. The students answered in different ways to the questionnaires. By looking at the previous chart’s projects results for this group, the duration of the project increases and the final cost of it decreases when the students use PTB. There is a tradeoff between duration and cost.
Here’s why we have diverged answers on the questionnaire.
- The group number 8 shows significant results in relation with the answers’ average chart. The project of the group number 8 exhibits increasing duration and increasing cost when the students use PTB. These two charts show a significant benefit when using MSP to manage the project. However, if we look at the previous chart of the answer’s average, the students prefer to work with PTB, and they think PTB helps them to manage their own project more.
- The results of group number 9 spotlight that the use of MSP to plan, schedule, and manage this project, is the best choice. Effectively, the duration and the cost of the project using PTB are higher than duration and cost of the project for the students using MSP. Even though we have clear results for the benefits of MSP for this project, the students’ opinions are very confused.
- The group number 10 shows important consequences. In fact, even if the students answered in different ways to the same questions, the two charts on the cost and duration variability of the projects clearly illustrate the use of PTB to manage the project increases the final performance of the project. Effectively the duration and cost of the project decrease when the students use PTB.
On the base of these important outcomes I have realized three different statistical tests to verify the existence of a possible correlation or any other significant results.
At the beginning I have applied a bivariate analysis. The bivariate analysis is one of the simplest forms of the quantitative analysis. It involves the analysis of two variables (often denoted as X, Y), for the purpose of determining the empirical relationship between them. In order to see if the variables are related to each other, it is common to measure how those two variables simultaneously change together.
I have adopted this method to investigate the preferences of the students and to identify the existence of any kind of trends.
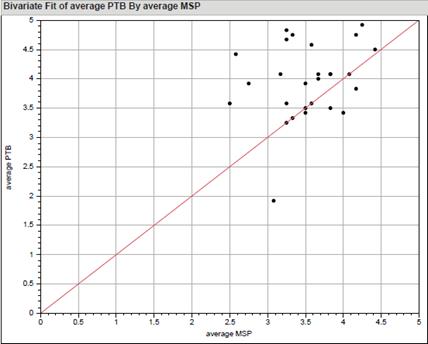
PICTURE n.20 bivariate analysis
The previous chart displays distinctly that the students prefer to work with Project Team Builder. As the chart shows most of the points are in the upper part of the diagram, or above the red line.
Also, this analysis is supported by the Wilcoxon matched pairs test.
The Wilcoxon signed-rank test is a non-parametric statistical hypothesis test used when comparing two related samples, matched samples, or repeated measurements on a single sample, in order to assess whether their population means ranks differ. It can be used as an alternative to the paired Student's t-test, t-test for matched pairs, or the t-test for dependent samples, when the population cannot be assumed to be normally distributed.
The chart below shows the results of the test. The value of the statistic test, marked by the blue circle, is below 0.05. For this reason we can affirm the test’s results are significant and the students prefer PTB rather than MSP.
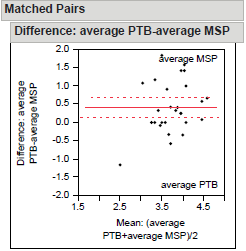
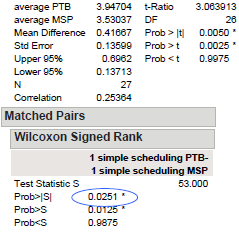
PICTURE n.21 Wilcoxon matched pairs test between average PTB and average MSP
The test’s results are satisfactory; therefore I applied the Wilcoxon matched pairs test to all the answers of the questionnaire. I identified significant results in 4 of the 12 questions of the questionnaire. The significant questions are:
Question N°1: How simple was it to schedule your project with this tool?
Question N°4: How simple was it to use the software for the first time?
Question N°7: How well did you understand the possible tradeoffs of your project?
Question N°12: Is it simple to change the screen view?
The diagrams below show the results found. The value of the statistical test is below the 0.05 level for all of the 4 significant questions
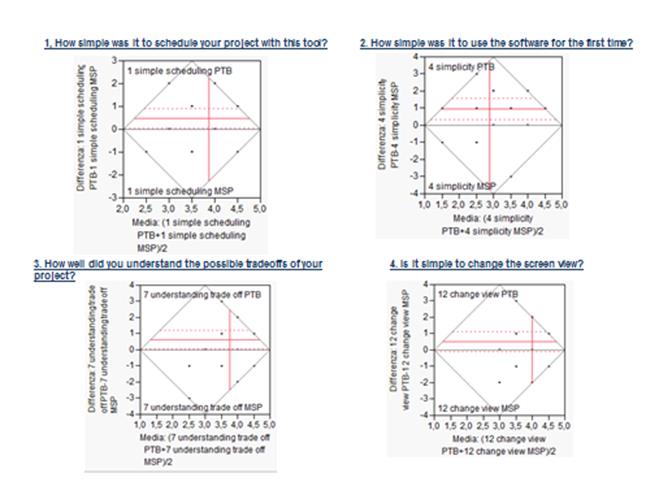
PICTURE n.22 Wilcoxn matched pairs test’s charts
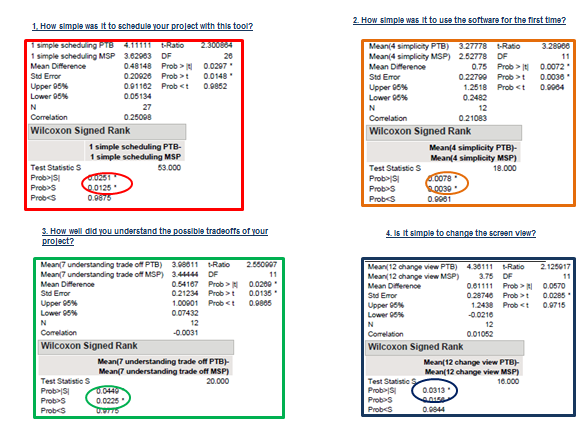
PICTURE n.23 Wilcox matched pairs test significant results
As explicated by the previous charts the students prefer Project Team Builder compared to Microsoft Project. The students think it is easier to schedule a project with PTB. Furthermore, because they consider MSP to be more complicated, the first time user students prefer to use PTB. They think PTB allows better the understanding of the tradeoff inside the project, also, making it easier to change the screen view in the software.
Moreover, I have completed the statistical analysis of the data looking for a possible correlation among the complexity of the project, the final results into Microsoft Project and Project Team Builder, and the students’ experiences.
Also, I have realized a multivariate analysis to achieve this scope.
Multivariate analysis (MVA) is based on the statistical principle of multivariate statistics, which involves observation and analysis of more than one statistical outcome variable at a time. In design and analysis, the technique is used to perform trade studies across multiple dimensions while taking into account the effects of all variables on the responses of interest.
Multivariate analysis can be complicated by the desire to include physics-based analysis to calculate the effects of variables for a hierarchical "system-of-systems." Often, studies that wish to use multivariate analysis are stalled by the dimensionality of the problem. These concerns are often eased through the use of surrogate models, highly accurate approximations of the physics-based code. Since surrogate models take the form of an equation, they can be evaluated very quickly.
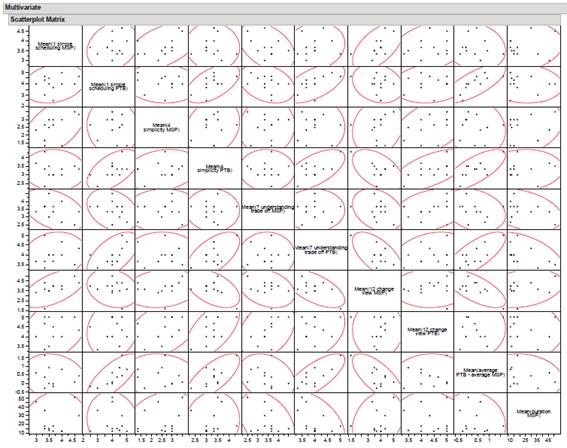
PICTURE n.24 Multivariate and correlation chart among the significant answers and the project results
The chart above illustrates the results of the multivariate analysis. Each square defines the correlation between two different variables. The red line forms design a shape, more the shape is tapered more the correlation between the two features is relevant, and more the test results are significant.
If we look at the diagram we can’t find any significant results or correlations. Therefore, we can affirm no correlations exist among the complexity of the project, the final results of the project using PTB and MSP, and the student’s experiences.
5.6 Results
The statistical analysis of the data collected in the first experiment has produced relevant outcomes.
The whole analysis highlights a students’ preference between PTB and MSP.
Effectively, the students prefer to work with Project Team Builder. The simulator software program allows an easier management of the project’s scheduling, planning and processing.
Therefore, if we look at the final performance achieved with PTB, only in a few cases the final performances are better than the ones we have when using MSP.
The explanations to these phenomena are various:
- We worked only onto twelve projects. For this reason the number of the collecting data is derisory and insufficient.
- Even though the twelve projects have the same number of milestones and respect the same goals and constraints, they are very different from one another. Furthermore, the students could decide the number and typology of resources, the duration of the project, and the relationship between the different tasks. For this reason the complexity of each project is very different and there is a wide variety of projects.
- The gap of information between the scheduling in MSP and the scenario on PTB is too large. The project’s scenario built on Project Team Builder scenario editor is a simplified version of the initial project scheduled on Microsoft Project.
The project has been simplified because the students are new user and they use Project Team Builder for the first time. Furthermore, I have tried to make the projects the most similar possible in order to guarantee homogeneity of the final performances. However, to build a similar project on PTB, to verify the final performance, and to reduce the information gap between all the projects we need more details on the initial version of the project.
One of the purposes this experiment was to demonstrate that the combination of PTB and MSP can increase the final performance in the management of complex engineering projects. Unfortunately the data show significant results only on the comparison of the two tools. From the combination of PTB and MSP, we have only non-quantitative results about the performance. The collected observations support my initial thesis but we have not enough numerical results to affirm that.
6. Qualitative research
The second part of the research considers a qualitative research.
Qualitative research methods are designed to help researchers understand people and what they say and do. They are designed to help researchers understand the social and cultural contexts within which people live.
One of the key benefits of qualitative research is that it allows a researcher to see and understand the context within which decisions and actions take place.
One of the primary motivations for doing qualitative research comes from the observation that, if there is one thing which distinguishes human from the natural world, it is their ability to talk. It is only by talking to people, or reading what they have written, that we can find out what they are thinking, and understanding their thoughts goes a long way towards explaining their action.
Several kinds of data collection techniques for a qualitative analysis exist, but for our research we have decided to adopt the interviews technique.
The interviews are one of the most important data gathering techniques for qualitative researches. They are used in almost all kinds of qualitative research (positivist, interpretive, or critical) and are the technique of choice in most qualitative research methods. Interview allows us to gather rich data from people in various roles and situations. A good interview helps us to focus on the subject’s world. The idea is to use their language rather than imposing one’s own. Overall, the more comfortable interviews are, and the more they are prepared to open up and talk, the better disclosure is likely to be.
There are many different kinds of interviews, but we have chosen for our analysis the structured interview. The structured interview involves the use of pre-formulated questions, usually asked in a specific order, and sometimes within a specified time limit. Structured interview requires considerable planning beforehand in order to make sure that all the important questions are included in the script from the beginning.
Conversely, structured interviews minimize the role of the interviewer during the interview itself, since there is no need for improvisation during the interview. The whole idea of structured interview is to ensure consistency across multiple interviews.
6.1 The experiment
In order to realize a qualitative analysis of the problem a second experiment has been designed. The second test has been achieved in collaboration with the Industrial and Management Engineering at Technion Israel Institute of Technology.
The test wants to identify which are the best performances of Project Team Builder (PTB) software developed by the research center of the Technion.
The main goal of this experiment is to understand and evaluate in depth the abilities and potentiality of the software.
A set of several interviews compose the test. The subjects that are chosen belong to a group of Technion students. These students are attending Professor Avhram Shtub’s project management class in the Industrial and Management Engineering Department. Each class is designed to teach the project management skills and how to use PTB.
The students will implement their final project for the class with PTB.
More information about PTB will be collected during the experiment. These data represent the start of the analysis and evaluation of the software. From the final conclusion it will be possible to find new ways of PTB implantation in order to improve its final performance.
6.2 Research Questions and Hypothesis
The intents of the experiment are:
- To analyze the performance of the software simulator Project Team Builder;
- To highlight the major PTB weaknesses;
- To purpose possible solutions and changes to increase the final performances of the software.
Two questions follow the experiment:
Q1: What is the main purpose of the software?
Q2: How can we improve the performances of PTB to increase the software product’s abilities and to drive PTB’s usability higher?
These experiment aims to fill gaps between the actual performance and the software’s goals. The final improvements at the end of this research want to improve the performance of PTB to guarantee more possibilities of success of complex engineering project. At the beginning of the experiment two important hypotheses are considered:
H1: PTB can be improved. Several weak points exist, and it is important to find them!
H2: The experiment has been performed on a group of Technion’s students. These students have been following Professor Avhram Shtub’s class about Project Management. At the beginning of the course they had the same primary skills on project management and on PTB simulator. Also, the group of students did not have a project management background.
To obtain significant results it was important to collect as much information as possible. Furthermore, the opening hypothesis will be tested to find the answers to the initial questions.
6.3 Research Method
The research information is collected with several interviews.
These interviews are performed in a quiet and silence room that could be laboratory or free classroom. The first relevant element for the success of the experiment is the fact that the student has to feel comfortable. Also, the location of the interview has to be appropriate. The student has to keep a high concentration, and for this reason it is fundamental to reduce any possible distraction in order to assure the validity of the test.
The experiment will be effectuated as an informal interview. The interviewer has to listen to each student individually for about 30 minutes each.
Before the experiment starts it is very important to explain and clarify to the subject all the interview steps. At the end of the document, in the appendix section, the list of all the steps that compose the interview is attached. (Appendix B). This document has been used to support the interviewer in the initial explanation.
The analysis and evaluation of the answers has been achieved in a second moment.
The entire interview’s duration is recorded after the student’s agreement. This document can be found in Appendix C, and this is the document that every student has to sign so the interviewer would get the permission to record the test.
6.3.1 Research map
The picture below shows the several steps that will follow during the whole experiment.
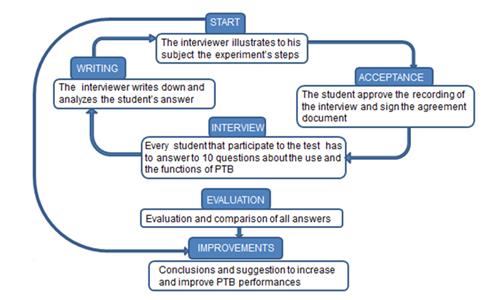
PICTURE n. 25 Research Map of the experiment 2
6.4 Details Design of the Experiments
In this part of the thesis the steps that compose the test, and the tools that will be used during the interview, are described.
6.4.1 Research map
The research map will explain the functionality and modality of use of every tool adopted in the experiment are explained
· Project Team Builder: The Project Team Builder (PTB), the core of our research, is a teaching aid designed to facilitate the teaching of project management in a dynamic, stochastic, multi-project environment. “The Project Team Builder is designed to train engineering students and managers to exploit the ability of modern decision support systems to collect, store, process and present large quantities of real time information.” (Shtub.2011). Professor Avhram Shtub teaches PTB in his project management’s class. The students that attend this class have to realize their final project using PTB.
· Recording device: The interview will be recorded with a recording device. The recording is fundamental because it allows to analyze and to evaluate the interviewed answers in depth in a second time, and not only at the experiment’s moment. However, before any type of recording the interviewer has to verify that the students have approved the recording.
6.4.2 The Measurements
The subject of this experiment was a group of students of the Technion Israel Institute of Technology in Haifa. These students have attended Professor Avhram Shtub’s class for one semester, and the aim of this course was to teach them the basic knowledge of project management.
At the end of the semester the students had to elaborate an own project. In this final project they were called to manage an important and complex management project using the PTB. The software was taught during the semester and it was be the central topic of the course. Also, the project was a requirement for the students in order to pass Professor Shtub’s class.
Furthermore, the group of students was a heterogeneous group, and it was composed by a set of ten students for each group, both from undergraduate and graduate studies. Additionally, they were part of different studies in different fields of the Technion.
The age range of the cluster was from 21 to 28, and they were with different education, background and work experiences.
This kind of group is ideal for the final results of the experiment, because it gives the opportunity to look at PTB from several points of view and it allows collecting a huge amount of data information.
6.4.3 The experiment procedure
The experiment is an informal interview. It is composed by six main steps. The list below explains in details every single phase.
Step 1: Start
The interviewer explains in depth to the interviewed every step that composes the test. The purpose of the experiment, the modality and the duration of the interview is clarified to the subject.
I built a document that will be used in this phase. The document is attached in the appendix (Appendix B). It helps and supports the interviewer in the description of the test steps to the student.
Step 2: Acceptance
The entire test is recorded. It is essential to illustrate to the subject all test phases, and to underline that the whole interview will be recorded.
The student has to approve both the recording and the test. The document that every subject has to sign to allow the recording can be found in appendix C. The signing of the paper is done before the experiment starts and at the end of the test’s description.
Once the interview is over the interviewer will give the student a copy of the document that he has signed at the beginning.
Step 3: The interview
The interview’s duration is about 30 minutes.
The dialogue is a set of 10 questions about the use of PTB. The purpose of the questions is to investigate what is the student’s opinion about the tool and what he thinks it could be changed in order to improve the software’s performances.
The 10 questions are collected in a document that is attached in the appendix at the end of these pages (Appendix D).
To guarantee the best results it is essential that the interviewer leave the student to express freely his own opinion about his experience with PTB.
The interview is concluded when the subject has answered to all ten questions.
Only when the interview finishes the recording is stopped.
Step 4: Writing
In this phase the interviewer listens the interview’s recording. He writes down the student’s answers and starts a first analysis of the data and information that he has just collected.
The first four steps, that have just been described, are repeated cyclically for all subjects’ interviews.
A second part of analysis, evaluation and conclusion follows this first interactive section.
Step 5: Evaluation
The interviewer analyzes and evaluates all the data and information that he collected in the first part of the experiment. The purpose of this phase is:
- Identify the similar answers. In fact, the analogue answers will be put together in the same cluster.
- Create a complete list with all the answers, ordered by importance. The criteria chosen to order all the answers will be decided after step 4 and before step 5.
- Underline what are the best and the worst features of the PTB.
Step 6: Improvements
This phase allows us to study and identify new ways to improve PTB’s performances, and it is the thorniest and most complicated step.
6.5 Data Analysis
The qualitative research interview seeks to describe the meanings of central themes in the life world of the subjects. The main task in interviewing is to understand the meaning of what the interviewees say. (Kvale, 1996)
Interviews are particularly useful for getting the story behind a participant’s experiences. The interviewer can pursue in-depth information around the topic. Also, interviews may be useful as follow-up to certain respondents to questionnaires, e.g., to further investigate their responses. (McNamara, 1999)
Interviews are one of the most important data gathering techniques for qualitative researchers in business and management. They allow us to gather rich data from people in various roles and situations.
A good interview helps us to focus on the subject’s world.
There are many different ways to analyze and interpret qualitative data.
· Coding: It is one of the simplest ways to analyze qualitative data. A code can be a word that is used to describe or summarize a sentence, a paragraph, or even a whole piece of text such as an interview. As soon as it is started coding a piece of text, it is been already started to analyze it. Coding is analysis. It has been assigned label to a chunk of textual data and classifying that chunk into a certain category. Coding helps to reduce the size of the data. The codes are useful for retrieving and organizing the data, and they speed up the analysis.
· Analytic induction: Analytic induction is a way to develop a casual explanation of a phenomenon from one or more cases. The analytic induction is a sequential of steps. First, define a phenomenon that requires explanation and propose an explanation. Next, examine a case to see if the explanation fits. If it does, then examine case is found that doesn’t fit, then, under the rules of analytic induction, the alternatives are to change the explanation or redefined the phenomenon. Ideally the process continues until a universal explanation for all known cases of phenomenon is attained.
· Series of events: It is a list of a series event. An event listing is a series of events organized by chronological time periods. The events can be sorted in categories. They can be described in narrative forms and/or summarized in a table or flow chart.
· Critical incidents: The critical incident approach involves asking people to discuss events or incidents that are deemed by the researcher to be extremely important and pertinent to the research. It provides a systemic means for gathering the significances other attach to events, analyzing the emerging patterns, and laying out tentative conclusions for the reader’s consideration. Although the critical incident technique has a strong positivist roots, it can be used with interpretative research as well.
· Hermeneutics: Hermeneutics can be treated as both an underlying philosophy, and a specific approach, to qualitative data analysis. It suggests a way of understanding textual data. One of the key concepts in hermeneutics is the idea of the hermeneutic circle that refers to the dialectic between the understanding of the text as a whole and the interpretation of its parts, in which descriptions are guided by anticipated explanation. The aim of the hermeneutic analysis could be one of trying to make sense of the whole and the relationship between the people and the company.
· Semiotics: Semiotics is primarily concerned with the analysis of signs and symbols, and their meaning. A sign or symbol is something that can stand for something else. According to Eco, semiotics is concerned with everything that can be taken as a sign. This means that words, images, taken as a sign.
· Content analysis: The content analysis is a research technique for making replicable and valid references from data to their contexts. The researcher searches for structures and patterned regularities in the text and makes inferences on the basis of these regularities. The researcher first of all develops a set of categories of words and phrases. These codes are then applied to units of text. Once the texts have been coded, various statistical techniques can be applied.
· Conversion analysis: Conversation analysis looks at the use of the language by people as a type of action, or as a skilled accomplishment by competent actors. A key concept within conversation analysis is the idea of the speaking turn. Conversation analysis is useful for analyzing the change meanings that can occur during verbal communications. It doesn’t presume the existence of fixed meanings in words and idioms; it assumes that the meanings are shaped in the context of the exchange.
· Discourse analysis: Discourse analysis looks at the way texts are constructed ad is concerned with the social contexts within which the text is embedded. The discourse analysis focuses mostly on language in use- the use of naturally occurring language in speech and/or written ext. discourse analysis is concerned with actual instances of language as used in communication.
· Narrative analysis: Narrative analysis is defined by the Concise Oxford English Dictionary as a spoken or written account of connected events. Traditionally, a narrative requires a plot, as well as some coherence. It has a linear structure, with a beginning, middle and end. Narrative analysis is a qualitative approach to the interpretation and analysis of qualitative data.
· Metaphorical analysis: A metaphor is the application of a name or descriptive term or phrase to an objective or action to which it is not literally applicable. Metaphorical analysis allows a systemic reflection of the metaphors in which, and through which, we perceive, speak, think, and act. The first step of the analysis is to identify the metaphors contained in the text. The second step involves sorting the metaphorical idioms and clustering them under a smaller number of concepts.
6.6 Results
The qualitative analysis has been the longest part of this research. The interviews have covered a period of 8 weeks.
At the end of this period I gathered information about Project Team Builder and its abilities.
As already mentioned, several methods exist to analyze the qualitative data.
I chose the Coding Method for the simplicity.
Picture n° shows a chart I built where I summarized in one word every answer of each interviewed subject. I tried to identify what were the recurring words and meaning. The chart below is a synthesis of all the interviews.
|
Did you know PTB before this course? |
No |
|
|
|
Have you ever used other project management software products before? Which one? |
MSP |
|
|
|
What is the important in software for Project Management? |
easy |
answer |
control |
|
What do you think about PTB in general? |
easy |
user-friendly |
|
|
What do you think about the PTB interface? |
essential |
|
|
|
If possible, what would you like to change? |
add more informations |
|
|
|
What do you think about the help support offered by PTB? Are the text boxes appearing during the simulation clear enough? |
yes |
|
|
|
What problems do you have using PTB? |
run |
modes' choice |
|
|
In your opinion, what are the major strengths of the software? |
helpful |
different alternatives |
|
|
In your opinion, what is the major weakness of the software? |
switch windows a lot of time |
saving in the builder |
statistical distribution |
CHART n. 6 coding method’s chart
Furthermore, I tried to describe the users’ present point of view and their opinion about the software program. I received several suggestions from the students during the interviews. They are a good starting point for my conclusions and considerations:
- It could be interesting to have a new version that integrates the Builder with the Simulator. This new version give the opportunity to the user to build and change the own scenario with the same tool and screen view.
- Now the user can import and export information on Microsoft Project only. This function could be extending to other project management software and database.
- PTB assigns the same Gaussian distribution to perform each mode for every task. It could be interesting for the expert users to give them the possibility to choose from several statistical distributions for each mode.
7. Discussion and Conclusions
The aim of this work was to analyze and evaluate different software products and techniques in order to enhance the team project performance in the management of complex engineering projects.
The main goals of this work are:
• To test what the best tools and techniques in the project management are
• To identify how to apply tools and techniques to increase project management performance
• To demonstrate how the combination of Microsoft Project(MSP) and Project Team Builder (PTB) improves the management of the projects
The research was divided in three sections:
1) Literature review: in this first section I have completed a comparison of the characteristics of Microsoft Project and Project Team Builder looking for more information in the literature
2) Quantitative analysis: in this unit I designed an experiment to collect data to support a quantitative analysis. The aim of this study is to individuate what is the best technique among Microsoft Project, Project Team Builder, and Microsoft Project and Project Team Builder combined, in order to manage and control a project.
3) Qualitative analysis: this last part wants to identify new solutions to improve the final performance of the Project Team Builder simulator. I have designed an experiment to collect data to support a qualitative analysis.
The research shows significant and relevant results.
I have demonstrated that the new users and expert users prefer working with Project Team Builder rather than with Microsoft Project. They consider Project Team Builder to be more practical and easier. They favor scheduling and planning a project with this software.
However, also on Microsoft Project the statistical results are positive. In fact, a group of students consider the Microsoft’s software product to be more advantageous when managing complex engineering projects.
Although there is not an understandable preference by the users for Project Team Builder, because of the different experience of the students, I have verified that, compared to Project Team Builder, Microsoft Project underestimates the final projects’ results.
In the light of the achieved results I think it is necessary to collect more data in order to evaluate the real performance of the combination of Project Team Builder and Microsoft Project.
I think it could be interesting to create a new experiment, so as to focus on the analysis of the comparison between Project Team Builder and the combination of Project Team Builder and Microsoft Project.
One of the weaknesses of the first experiment was the collecting data’s duration and the number of samples. In fact, in the new experiment I would suggest to extend the data collection duration, as well as to increase the number of samples, to facilitate the sufficiency of the data. Also, I would recommend the realization of the new experiment on a group of expert users of Project Team Builder rather than new users.
These new suggestions would allow us to reduce the differences between the first version of the project, the one on Microsoft Project, and the second version of the project, the one on Project Team Builder. Furthermore, the expert users, since more informed and prepared on the software, would pledge the maximization of the final performance in both cases.
For all the reasons mentioned we can believe this work has significant results. It is an important contribution for the analysis of new tools and techniques in project management, and the final results could be the beginning of a new research.
8. Appendix
8.1 Appendix A
Questionnaire No 1: After Planning with MS-Project
This test is part of research carried out in the Faculty of Management and Industrial Engineering of Technion Israel Institute of Technology. The results of the questionnaire will be used only for scientific purposes and will be not transferred to any third party.
The questionnaire below focuses on the evaluation of Project Team Builder combined with Microsoft Project during the planning phase of the project.
The following questions are related to decision making that you have performed in the planning phase of your project.
Please answer the following questions based on your experience.
|
|
Not at all |
|
|
|
To a great extent |
|
How simple was your project with this tool was simple |
1 |
2 |
3 |
4 |
5 |
|
Did the simplicity and usability of the software help in the planning and scheduling phase |
1 |
2 |
3 |
4 |
5 |
|
Was the global vision of your scheduling clear? |
1 |
2 |
3 |
4 |
5 |
|
How simple was it to use the software for the first time? |
1 |
2 |
3 |
4 |
5 |
|
How well did you understand the project goals? |
1 |
2 |
3 |
4 |
5 |
|
How well did you understand the work process? |
1 |
2 |
3 |
4 |
5 |
|
How well did you understand the possible tradeoffs of your project? |
1 |
2 |
3 |
4 |
5 |
|
How clear were the decisions to be made? |
1 |
2 |
3 |
4 |
5 |
|
How friendly is the usability of the software interface? |
1 |
2 |
3 |
4 |
5 |
|
Does the use of graphical elements to increase the informative content |
1 |
2 |
3 |
4 |
5 |
|
Is the software easy to learn? |
1 |
2 |
3 |
4 |
5 |
|
Is it simple to change the screen view? |
1 |
2 |
3 |
4 |
5 |
Project name: ______________ Role in project team: PM/SE/QA
Duration (in month) _________ Cost__________________
Additional notes and comments:
____________________________________________________________________________________________________________________________________________________________________________
For our analysis, please supply us with the following personal information:
Gender: Male / Female Age: _________
Training in project management in the past: Yes / No
Thanks for your cooperation.
Questionnaire No 2: After Simulation with Project Team Builder
This test is part of research carried out in the Faculty of Management and Industrial Engineering of Technion Israel Institute of Technology. The results of the questionnaire will be used only for scientific purposes and will be not transferred to any third party.
The questionnaire below focuses on the evaluation of Project Team Builder combined with Microsoft Project during the planning phase of the project.
The following questions are related to decision making that you have performed in the planning phase of your project.
Please answer the following questions based on your experience.
|
|
Not at all |
|
|
|
To a great extent |
|
How simple was it your project with this tool was simple |
1 |
2 |
3 |
4 |
5 |
|
Did the simplicity and usability of the software help in the planning and scheduling phase |
1 |
2 |
3 |
4 |
5 |
|
Was the global vision of your scheduling clear? |
1 |
2 |
3 |
4 |
5 |
|
How simple was it to use the software for the first time? |
1 |
2 |
3 |
4 |
5 |
|
How well did you understand the project goals? |
1 |
2 |
3 |
4 |
5 |
|
How well did you understand the work process? |
1 |
2 |
3 |
4 |
5 |
|
How well did you understand the possible tradeoffs of your project? |
1 |
2 |
3 |
4 |
5 |
|
How clear were the decisions to be made? |
1 |
2 |
3 |
4 |
5 |
|
How friendly is the usability of the software interface? |
1 |
2 |
3 |
4 |
5 |
|
Does the use of graphical elements to increase the informative content |
1 |
2 |
3 |
4 |
5 |
|
Is the software easy to learn? |
1 |
2 |
3 |
4 |
5 |
|
Is it simple to change the screen view? |
1 |
2 |
3 |
4 |
5 |
Project name: ______________ Role in project team: PM/SE/QA
Duration (in month) _________ Cost__________________
Additional notes and comments:
____________________________________________________________________________________________________________________________________________________________________________
For our analysis, please supply us with the following personal information:
Gender: Male / Female Age: _________
Training in project management in the past: Yes / No
Thanks for your cooperation.
Questionnaire No 3: After the combining of PTB and MSP
This test is part of research carried out in the Faculty of Management and Industrial Engineering of Technion Israel Institute of Technology. The results of the questionnaire will be used only for scientific purposes and will be not transferred to any third party.
The questionnaire below focuses on the evaluation of Project Team Builder combined with Microsoft Project during the planning phase of the project.
The following questions are related to decision making that you have performed in the planning phase of your project.
Please answer the following questions based on your experience.
|
|
Not at all |
|
|
|
To a great extent |
|
How simple was it your project with this tool was simple |
1 |
2 |
3 |
4 |
5 |
|
Did the simplicity and usability of the software help in the planning and scheduling phase |
1 |
2 |
3 |
4 |
5 |
|
Was the global vision of your scheduling clear? |
1 |
2 |
3 |
4 |
5 |
|
How simple was it to use the software for the first time? |
1 |
2 |
3 |
4 |
5 |
|
How well did you understand the project goals? |
1 |
2 |
3 |
4 |
5 |
|
How well did you understand the work process? |
1 |
2 |
3 |
4 |
5 |
|
How well did you understand the possible tradeoffs of your project? |
1 |
2 |
3 |
4 |
5 |
|
How clear were the decisions to be made? |
1 |
2 |
3 |
4 |
5 |
|
How friendly is the usability of the software interface? |
1 |
2 |
3 |
4 |
5 |
|
Does the use of graphical elements to increase the informative content |
1 |
2 |
3 |
4 |
5 |
|
Is the software easy to learn? |
1 |
2 |
3 |
4 |
5 |
|
Is it simple to change the screen view? |
1 |
2 |
3 |
4 |
5 |
Project name: ______________ Role in project team: PM/SE/QA
Duration (in month) _________ Cost__________________
Additional notes and comments:
____________________________________________________________________________________________________________________________________________________________________________
For our analysis, please supply us with the following personal information:
Gender: Male / Female Age: _________
Training in project management in the past: Yes / No
Thanks for your cooperation.
Questionnaire for the faculty of Management and Industrial Engineering
This test is part of research carried out in the Faculty of Management and Industrial Engineering of Technion Israel Institute of Technology. The results of the questionnaire will be used only for scientific purposes and will be not transferred to any third party.
The questionnaire below focuses on the evaluation of Project Team Builder combined with Microsoft Project during the planning phase of the project.
The following questions are related to decision making that you have performed in the planning phase of your project.
Please answer the following questions based on your experience.
|
|
Not at all |
|
|
|
To a great extent |
|
How simple was it your project with this tool was simple |
1 |
2 |
3 |
4 |
5 |
|
Did the simplicity and usability of the software help in the planning and scheduling phase |
1 |
2 |
3 |
4 |
5 |
|
Was the global vision of your scheduling clear? |
1 |
2 |
3 |
4 |
5 |
|
How simple was it to use the software for the first time? |
1 |
2 |
3 |
4 |
5 |
|
How well did you understand the project goals? |
1 |
2 |
3 |
4 |
5 |
|
How well did you understand the work process? |
1 |
2 |
3 |
4 |
5 |
|
How well did you understand the possible tradeoffs of your project? |
1 |
2 |
3 |
4 |
5 |
|
How clear were the decisions to be made? |
1 |
2 |
3 |
4 |
5 |
|
How friendly is the usability of the software interface? |
1 |
2 |
3 |
4 |
5 |
|
Does the use of graphical elements to increase the informative content |
1 |
2 |
3 |
4 |
5 |
|
Is the software easy to learn? |
1 |
2 |
3 |
4 |
5 |
|
Is it simple to change the screen view? |
1 |
2 |
3 |
4 |
5 |
For statistical reasons, can you please supply us with the following personal information?
Gender: Male / Female Age: _________
Education: Bachelor/Master/Phd
Training on project management in the past: Yes / No
Additional notes and comments:
____________________________________________________________________________________________________________________________________________________________________________
Thanks for your cooperation.
8.2 Appendix B
THE OUR INTERVIEW
The main aim of this document is clarify and inform you about scope, modality and steps that we will follow during our interview.
This interview is part of research project, born by the collaboration between Politecnico di Milano and Technion Israel Institute of Technology. I will use the results of your test to analyze and to study the PTB performance and to suggest change to improve the functionality of the tool.
I would like you feel free to say your opinion and your thinking about the questions that I will do.
Before to start you have to know I would like to record the interview but I need your authorization. You can find the agreement paper at the end of this document.
The interview goes on only for 30 minutes.
I will ask you ten questions focus on understand PTB performance and your experience with the software.
Thank you very much for your help and for your free time.
Francesca Coffani
8.3 Appendix C
![]()
AGREEMENT FOR THE REGISTRATION
Personal informations:
Name:
Last name:
Data of birth: (dd/mm/yy) Place:
Mobile:
E-mail:
Studies: bachelor / master student
Faculty:
I declare to have read all the informations about this interview.
In according with the first document I AGREE to my interview is recorded.
I AGREE to this recording will be used only for the purpose of scientific research.
Haifa,
Sign
8.4 Appendix D
![]()
QUESTIONNAIRE
1. Do you know PTB before of this course?
2. Have you ever used other project management tools before?
3. If yes, which?
4. What is the important thing in a tool for Project Management?
5. What do you think about PTB in general?
6. How many times have you used PTB before of this interview? Do you have any problems to learn how use it? What kind?
7. What do you think about the PTB interface?
8. If it possible, what would you like to change?
9. What do you think about the help support offered by PTB? The text box that appear during the simulation are enough clear?
10. What problems do you have during the building of your scenario?
11. Which problems do you have during the simulation of your scenario?
12. In your opinion, what are the major strengthens of the software?
13. In your opinion, what is the major weakness of the software?
14. Do you have any advice to improve the
9. References
http://gcimmarrusti.wordpress.com/pm-quotes/
http://infolific.com/technology/project-management/two-project-management-metaphors/
Chatfield, Carl. "A short course in project management". Microsoft.
The Definitive Guide to Project Management. Nokes, Sebastian. 2nd Ed.n. London (Financial Times / Prentice Hall): 2007. ISBN 978-0-273-71097-4
http://pm.stackexchange.com/questions/3122/definition-of-project-success
Paul C. Dinsmore et al (2005) The right projects done right! John Wiley and Sons, 2005. ISBN 0-7879-7113-8.
Lewis R. Ireland (2006) Project Management. McGraw-Hill Professional, 2006. ISBN 0-07-147160-X.
Joseph Phillips (2003). PMP Project Management Professional Study Guide. McGraw-Hill Professional, 2003. ISBN 0-07-223062-2
PMI (2010). A Guide to the Project Management Body of Knowledge
Davidovitz, L. , Parush, A. amd Shtub, A., Simulation-based learning in engineering education: Performance and transfer in learning project management, Journal of Engineering Education, October 2006, 289-299
John D. Sterman Director, System Dynamics Gorup Sloan School of Management Massachusetts Institute of Technology, “System Dynamics Modeling for Project Management”, Cambridge MA 02139
http://www.pmi.org/About-Us/About-Us-What-is-Project-Management.aspx
http://en.wikipedia.org/wiki/Project_Management_Institute
http://blog.simcrest.com/introduction-to-the-nine-project-management-knowledge-areas/
http://www.techopedia.com/definition/13132/project-management-software
Project Management System Evaluation Checklist By Tim Bryce
http://www.projectsmart.co.uk/project-management-system-evaluation-checklist.html
Project Management Institute "Project Management Institute Honors The Technion-Israel Institute of Technology", October 20, 2008
Shtub Avraham, "Project Management Simulation with PTB Project Team Builder", Springer Science+Business Media, 2012, March, ISBN 978-1-4419-6462-5
"Project Requirements". Microsoft Office website. Microsoft. Retrieved 20 January 2013.
"Steve Ballmer: Microsoft Office Project Conference 2007". News Center. Microsoft. 30 October 2007. Retrieved 20 January 2013.
"PRJ98: List of Fixes in Microsoft Project 98 SR-1". News Center. Microsoft. 18 September 2011. Retrieved 20 January 2013.
Previous Versions of Microsoft Project at the Wayback Machine (archived January 12, 2009)
"Microsoft Project 2010 Ribbon Guide" (Silverlight animation). Microsoft Project Training. Microsoft. Retrieved 20 January 2013.
http://eprogramme.wordpress.com/2011/05/13/microsoft-project-2010-top-10-benefits/
Vanhoucke, M. and A. Shtub, January, 2011, PM World Today,(featured paper), Vol. XIII, Issue I
“Educational Software: criteria for evaluation” by H. Geissinger, Instructional Media & Design
“Software evaluation: criteria-based Assessment” by Mike Jackson, Steve Crouch and Rob Baxter, Software Sustainability Insistute
Uday Gajendar “MS Project != design happiness” March 27th, 2008 http://www.ghostinthepixel.com/?p=115
EPMA Enterprising, Progressive, Managed and Acknowledged: http://epmainc.com/free-download-quick-reference-card-microsoft-project-2010
Microsoft website: http://www.microsoft.com/en-us/legal/intellectualproperty/Trademarks/Usage/General.aspx
Simulator-Based Team Training to Share Resources in a Matrix Structure Organization, Lior Davidovitch, Avi Parush, and Avraham Shtub, IEEE TRANSACTIONS ON ENGINEERING MANAGEMENT, VOL. 57, NO. 2, MAY 2010
Simulation-based Learning in Engineering Education: Performance and Transfer in Learning Project Management, Journal of Engineering Education, Oct 2006 by Davidovitch, L,Parush, A, Shtub
Simulation-based learning: The learning–forgetting–relearningprocess and impact of learning history; Lior Davidovitch, Avi Parush , Avy Shtub; Industrial Engineering and Management, Technion – Israel Institute of Technology, Haifa 32000, Israel; Department of Psychology, Carleton University, Ottawa, Ont., Canada K1S 5B6; Received 24 November 2005; received in revised form 29 August 2006; accepted 11 September 2006
Project Management Simulation-Based Learning For Systems Engineering Students Lior Davidovitch, Avy Shtub, Avi Parush, Industrial Engineering and Management, Technion - Israel Institute ofTechnology, Haifa 32000, Israel; Department ofPsychology,Carleton University,Ottawa, Ont., CanadaK]S5B6
DEVELOPING THEORY THROUGH SIMULATION METHODS
JASON P. DAVIS; KATHLEEN M. EISENHARDT; Stanford University; CHRISTOPHER B. BINGHAM; University of Maryland
Integrating a Training Simulator and a Decision-Support System for Project Managers and System Engineers; Michal Iluz; submitted to the senate of the Technion; Israel Institute of technology; Haifa January 2012.
Solving Multi Criteria Decision Problems in Project Management to Findthe Efficient Frontier in Stochastic Resource Constraints Problems; Oriana Bala;By the Guidance of Professor Avraham Shtub in the Faculty of industrial Engineering and Management, Technion IIT
Simulator Based Training for Project Teams in Lean Project Management for Enhanced Performance; Michal Iluz; Israel Institute of Technology Haifa, March 2013
PMBOK Guide Third Edition 2004 p.1
“Systems Engineer” From Patricia Pickett, former About.com Guide
http://wiki.answers.com/Q/What_is_the_role_of_quality_analyst
“Qualitative research in business and management” by Michael D.Mayers, SAGE Publication Ltd 2009
“quantitative technique for business” University of Calicut, Calicut University P.O. Malappuram, Kerala, India
http://en.wikipedia.org/wiki/JMP_(statistical_software)
Gelman, Andrew (2008). "Variance, analysis of". The new Palgrave dictionary of economics (2nd ed.). Basingstoke, Hampshire New York: Palgrave Macmillan. ISBN 978-0-333-78676-5
Cochran, William G.; Cox, Gertrude M. (1992). Experimental designs (2nd ed.). New York: Wiley. ISBN 978-0-471-54567-5
Hinkelmann, Klaus & Kempthorne, Oscar (2008). Design and Analysis of Experiments. I and II (Second ed.). Wiley. ISBN 978-0-470-38551-7
Moore, David S. & McCabe, George P. (2003). Introduction to the Practice of Statistics (4e). W H Freeman & Co. ISBN 0-7167-9657-0
Earl R. Babbie, The Practice of Social Research, 12th edition, Wadsworth Publishing, 2009, ISBN 0-495-59841-0, pp. 436–440
Bivariate Analysis, Sociology Index
Lowry, Richard. "Concepts & Applications of Inferential Statistics". Retrieved 24 March 2011.
T. W. Anderson, An Introduction to Multivariate Statistical Analysis, Wiley, New York, 1958.
KV Mardia, JT Kent, and JM Bibby (1979). Multivariate Analysis. Academic Press,. (M.A. level "likelihood" approach)
Feinstein, A. R. (1996) Multivariable Analysis. New Haven, CT: Yale Univ